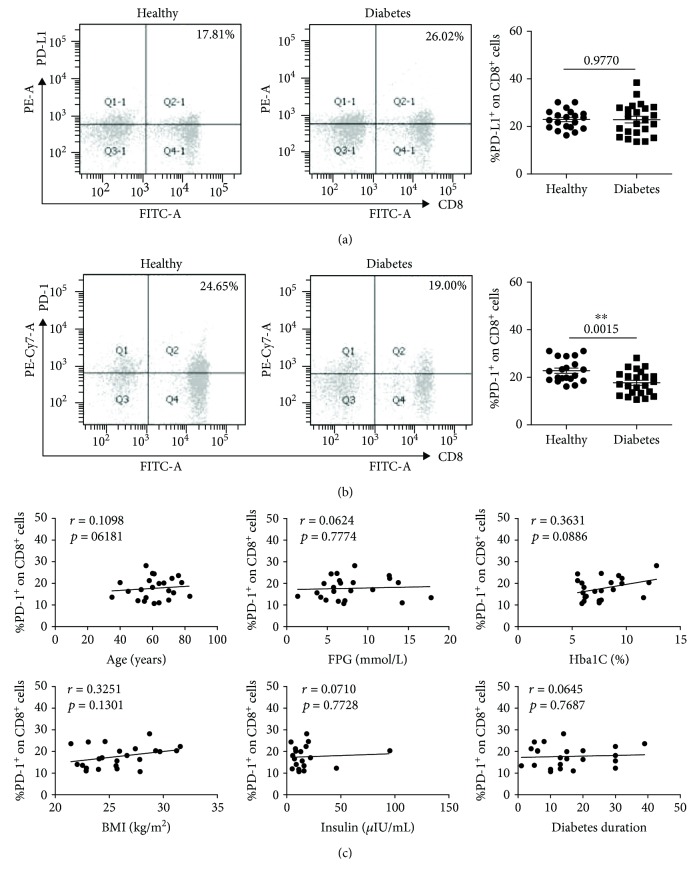
Figure 2.
The expressions of PD-L1 and PD-1 on CD8+ T cells (marked with CD3+CD8+) in T2D patients and healthy donors. (a) Typical flow cytometry analysis of the PD-L1 expression on CD8+ T cells (left) and the statistical graph (right) are shown for the T2D patients (n = 23, 22.88 ± 1.39%) and healthy donors (n = 20, 22.93 ± 0.90%). (b) Typical flow cytometry analysis of the PD-1 expression on CD8+ T cells (left) and the statistical graph (right) are shown for the T2D patients (n = 23, 17.73 ± 1.04%) and healthy donors (n = 20, 22.82 ± 1.08%). (c) Correlation analysis of the PD-1 expression on CD8+ T cells and age, fasting plasma glucose (FPG), glycated hemoglobin (HbA1C), body mass index (BMI), insulin, and diabetes duration. ∗∗ P < 0.01.

