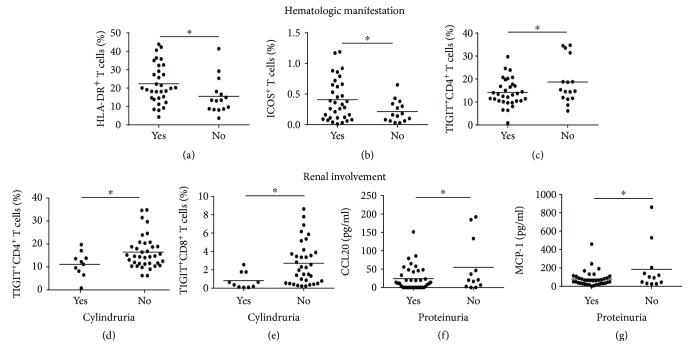
Figure 6.
Variable expression of HLA-DR, ICOS, and TIGIT on T cells in SLE patients with organ involvement. SLE patients were divided into different groups according to their hematologic or renal manifestations. (a–c) Frequencies of HLA-DR+CD3+ T cell (a), ICOS+ T cell (b), and TIGIT+CD4+ T cell (c) in SLE patients with or without active hematologic manifestations. (d–g) Frequencies of TIGIT+CD4+ T cell (d) and TIGIT+CD8+ T cell (e) and level of serum CCL-20 (f) and MCP-1 (g) in patients with or without active renal manifestations. Each dot represents an individual subject. ∗ P < 0.05.

