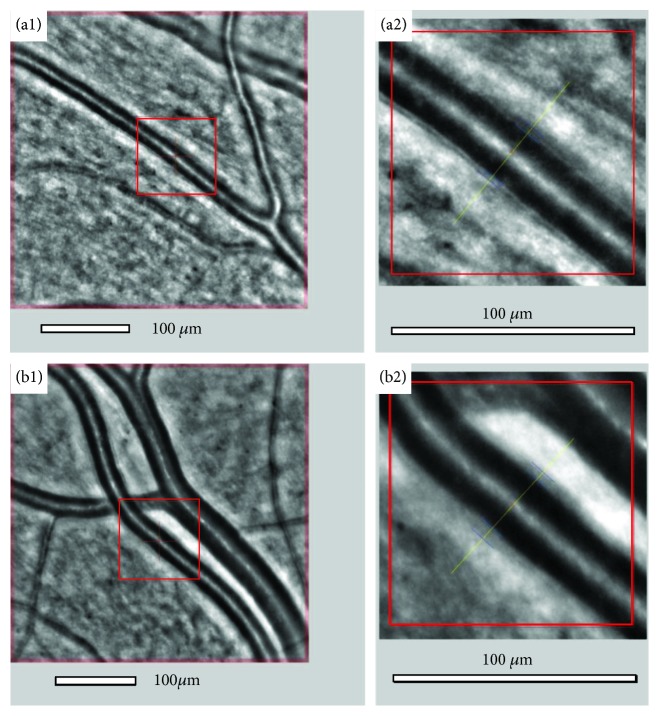
Figure 3.
Image of the retinal artery of a patient (WLR 0.250) from the control group (a1, a2) and from the DR group with diabetes and hypertension (WLR 0.360) (b1, b2) captured with the rtx1 adaptive optics retinal camera obtained automatically, with wall and lumen visualization using AOdetectArtery.

