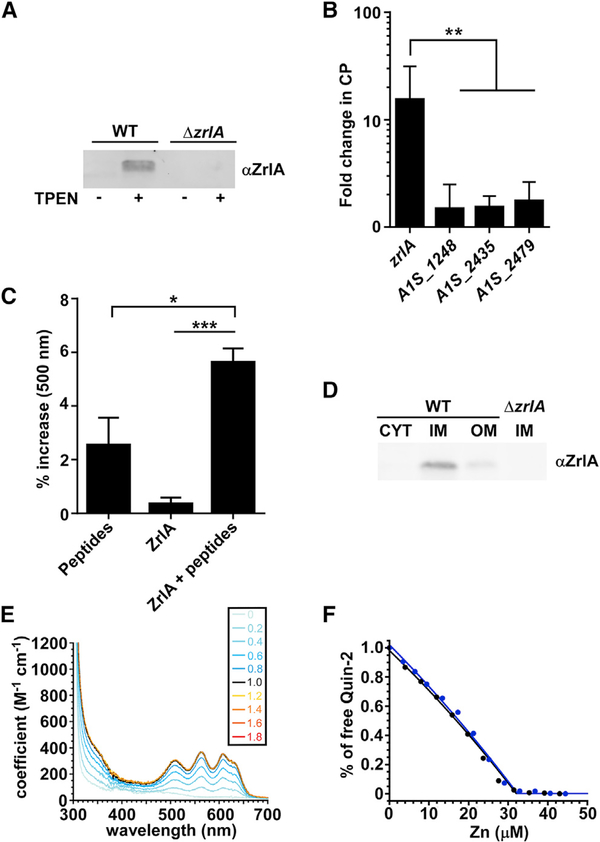
Figure 1. ZrlA Is a Peptidase Induced during Zn Starvation.
(A) ZrlA expression was assessed in wild-type (WT) and ΔzrlA (15 μg protein/lane) by immunoblot after growth in lysogeny broth (LB) ± 40 μM TPEN.
(B) Transcriptional changes for zrlA and other predicted d,d-CPases A1S_1248, A1S_2435, and A1S_2479 were assessed by qRT-PCR + 250 μg/ml CP. **p < 0.01 as determined by one-way ANOVA with Tukey multiple comparisons test on three independent experiments, means ± SD.
(C) Modified cadmium-ninhydrin assay was performed on recombinant MBP-ZrlA in the presence of a peptide substrate. *p < 0.05, ***p < 0.001 as determined by one-way ANOVA with Tukey multiple comparisons test on three independent experiments, means ± SD.
(D) ZrlA protein localization was assessed in WT and ΔzrlA (7.5 μg protein/lane) by immunoblot of membrane fractions following growth in LB ± 40 μM TPEN.
(E) CoII titration, where a tetrahedral or distorted tetrahedral coordination geometry is suggested with a d-d transition of 400 M−1 • cm−1 at 600 nm (Corwin and Koch, 1987). Inset, number of CoII:ZrlA42C mol • equivalents corresponding to each spectrum shown; note that all spectra acquired at CoII:ZrlA42C overlap, revealing a 1:1 metal binding stoichiometry.
(F) Normalized binding titration of a mixture of ZrlA42C and competitor quin-2 with Zn in two independent experiments: 17.0 μM ZrlA42C with 15.2 μM quin-2 (blue filled circles) and 15.1 μM ZrlA42C with 12.3 μM quin-2 (black filled circles). The continuous lines represent the results of a nonlinear, least-squares fit to a Zn:ZrlA42C = 1:1 binding model. The global fitting results in KZn = 3.6 (±0.4) × 1011 M− 1.
See also Figure S1.

