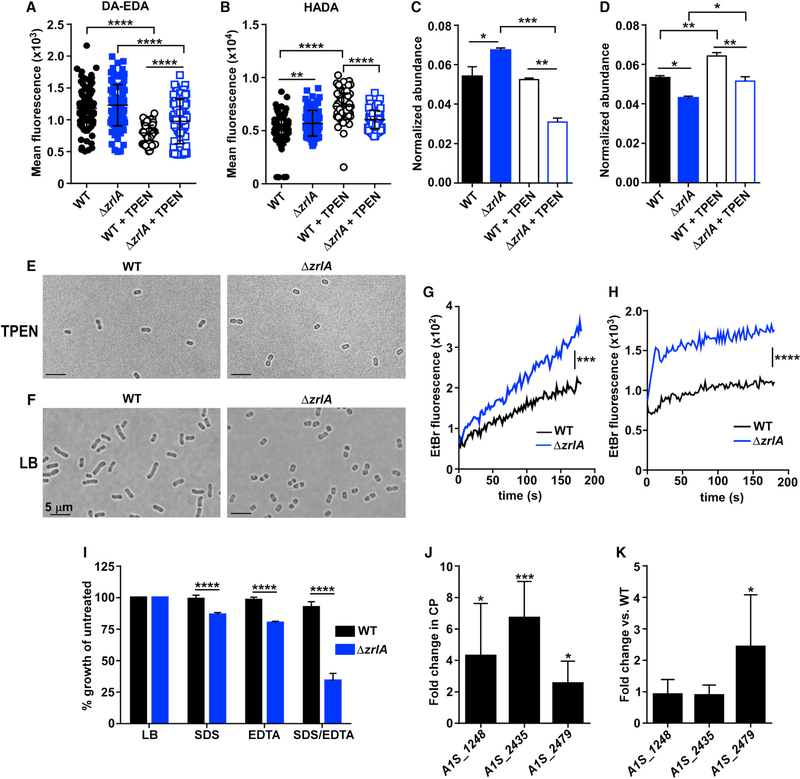
Figure 2. ZrlA Contributes to Cellular Morphology and Envelope Integrity.
(A) Mean fluorescence of WT or ΔzrlA ± 10 μΜ TPEN after DA-EDA labeling of the fifth position of PG pentapeptides. ****p < 0.0001 as determined by one-way ANOVA with Tukey multiple comparisons test (n = 100 cells/group).
(B) Mean fluorescence of WT or ΔzrlA ± 10 μM TPEN after HADA labeling of the fourth position of PG pentapeptides **p < 0.01, ****p < 0.0001 as determined by one-way ANOVA with Tukey multiple comparisons test (n = 100 cells/group).
(C) Normalized abundance of PG muropeptide tripeptide monomers (sum M3, M3(−N-acetylglucosamine [GlcNAc]; see Figure S2 for a representative liquid chromatography-tandem mass spectrometry (LC-MS/MS) chromatogram and Table S1 for muropeptide designations and expected and experimental masses) in WT or ΔzrlA ± 40 μM TPEN.
(D) Normalized abundance of muropeptide tetrapeptide monomers (sum M4,M4[–GlcNAc]) (Figure S2; Table S1) in WT or ΔzrlA ± 40 μM TPEN. *p < 0.05, **p < 0.01, ***p < 0.001 as determined by one-way ANOVA with Tukey multiple comparisons test on biological duplicates, means ± SD.
(E) Microscopy of WT or ΔzrlA A. baumannii grown to mid-log in LB + 40 μM TPEN (100×).
(F) Microscopy of WT or ΔzrlA A. baumannii grown to mid-log in LB (100×). Scale bar, 5 μm.
(G) Ethidium bromide uptake following growth in LB. ***p < 0.001 as determined by Student’s t test of mean line slopes from three independent experiments.
(H) Ethidium bromide uptake following growth in 40 μM TPEN, ****p < 0.0001 as determined by Student’s t test of mean line slopes from three independent experiments.
(I) Percentage of growth as determined by optical density 600 (OD600) at 8 h of growth in LB, 0.01% SDS, or 0.01 mM EDTA for WT and ΔzrlA compared with untreated samples. ****p < 0.05 as determined by Student’s t test from three independent experiments, means ± SD.
(J) ΔzrlA was subjected to qRT-PCR analysis of putative d,d-CPases in 250 μg/ml CP. *p < 0.05, ***p < 0.001 as determined by Student’s t test from three independent experiments, means ± SD.
(K) ΔzrlA was subjected to qRT-PCR analysis of putative d,d-CPases in LB compared with expression in the WT strain. *p < 0.05 as determined by Student’s t test from three independent experiments, means ± SD.
See also Table S1 and Figure S2.

