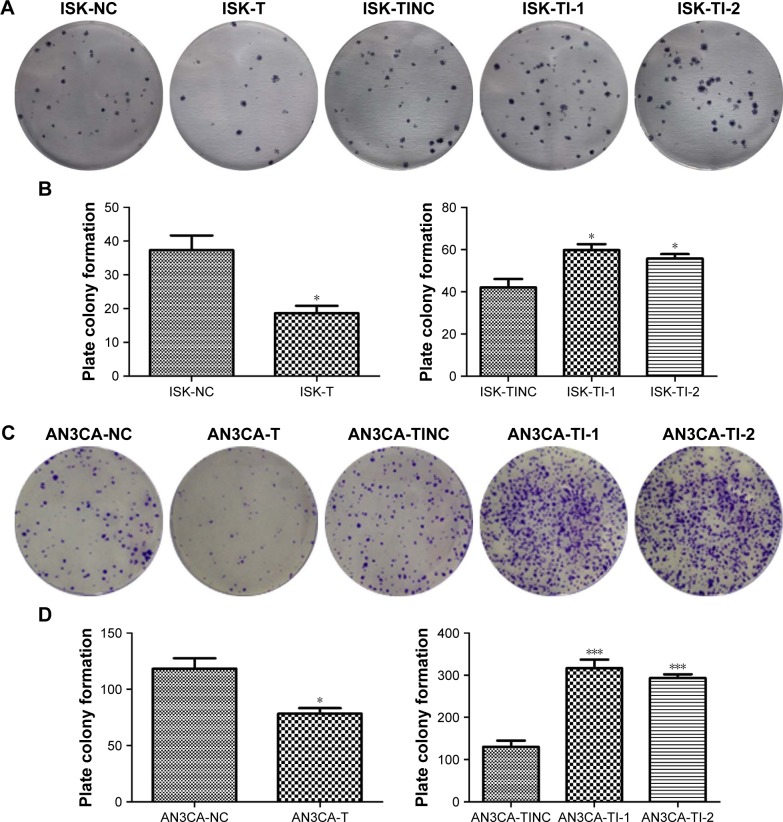
Figure 3.
The effect of TRIB3 on ISK and AN3CA cell proliferation was evaluated by the plate colony formation assay.
Notes: The clone formation ability of (A) ISK and (C) AN3CA cells were examined, and the results of statistical analyses of the plate colony formation ability of (B) ISK and (D) AN3CA cells are presented. NC: TRIB3 overexpression negative control group; T: TRIB3 overexpression group; TI-1: TRIB3-shRNA plasmid 1 group; TI-2: TRIB3-shRNA plasmid 2 group; TINC: TRIB3-shRNA inhibitor negative control group. *P<0.05, and ***P<0.001, compared with the respective control groups by t-test. Data were obtained from three independent experiments.

