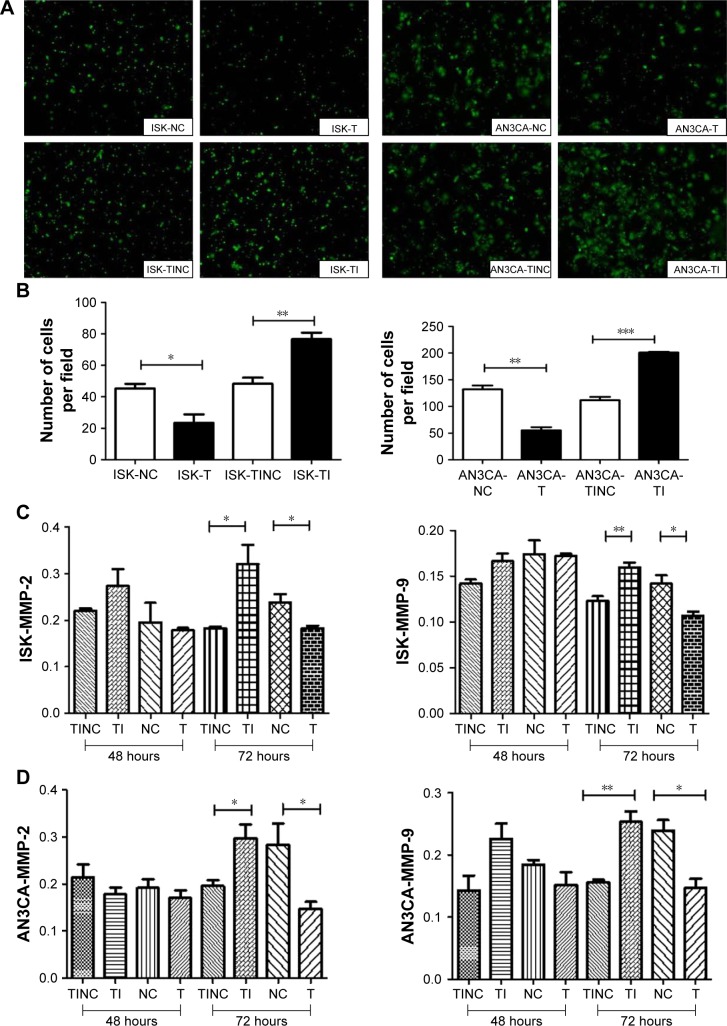
Figure 5.
Cell migration was measured by a transwell migration assay.
Notes: (A) Transwell assays of ISK and AN3CA cells. (B) Quantification of transwell assays in ISK and AN3CA cells. (C) Expression levels of MMP-2 and MMP-9 in ISK cells. (D) Expression levels of MMP-2 and MMP-9 in AN3CA cells. *P<0.05, **P<0.01, and ***P<0.001, compared with the respective control groups by t-test. Data were obtained from three independent experiments.
Abbreviations: NC, TRIB3 overexpression negative control group; T, TRIB3 overexpression group; TI-1, TRIB3-shRNA plasmid 1 group; TI-2, TRIB3-shRNA plasmid 2 group; TINC, TRIB3-shRNA inhibitor negative control group.

