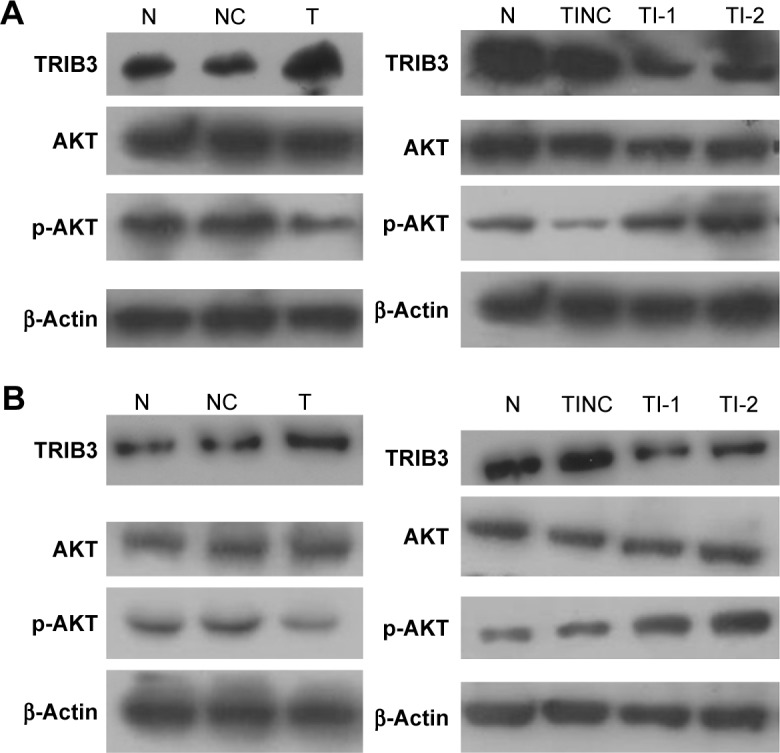
Figure 6.

AKT and p-AKT levels in (A) ISK cells and (B) AN3CA cells were examined by Western blot. N, normal control group; NC: TRIB3 overexpression negative control group; T: TRIB3 overexpression group; TI: TRIB3 inhibitor group; TI-1: TRIB3-shRNA plasmid 1 group; TI-2: TRIB3-shRNA plasmid 2 group; TINC: TRIB3-shRNA inhibitor negative control group.
