Figure 3.
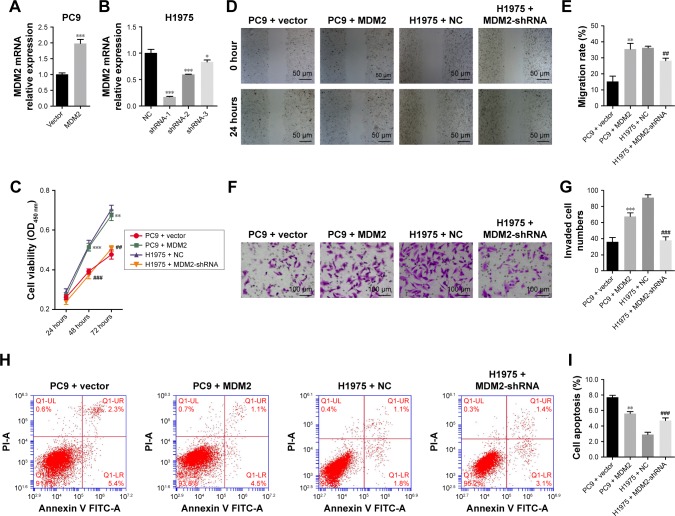
Effect of MDM2 on cell viability, migration, invasion, and apoptosis.
Notes: PC9 and H1975 cells were transfected with MDM2 overexpressing and MDM2-shRNA expressing lentiviruses, respectively. (A and B) MDM2 mRNA relative expression levels in transfected PC9 and H1975 cells. GAPDH was used as reference control gene. (C) Cell proliferation analysis by MTT assay. (D and E) In vitro wound healing assay (scratch assay). Migration index was calculated as (W0 h–W24 h) ×100%/W0 h. (F and G) In vitro cell invasion analysis by Transwell assay. (H and I) Apoptosis by flow cytometric analysis. Cells were transfected with plasmids for 48 hours, except for proliferation analysis by MTT assay. The empty plasmid (vector) or negative control for shRNA (NC) was used as control. *P<0.05, **P<0.01, and ***P<0.001, vs PC9+ vector, respectively. ##P<0.01 and ###P<0.001, vs H1975 + NC, respectively.
Abbreviations: MDM2, mouse double minute 2; NC, negative control.

