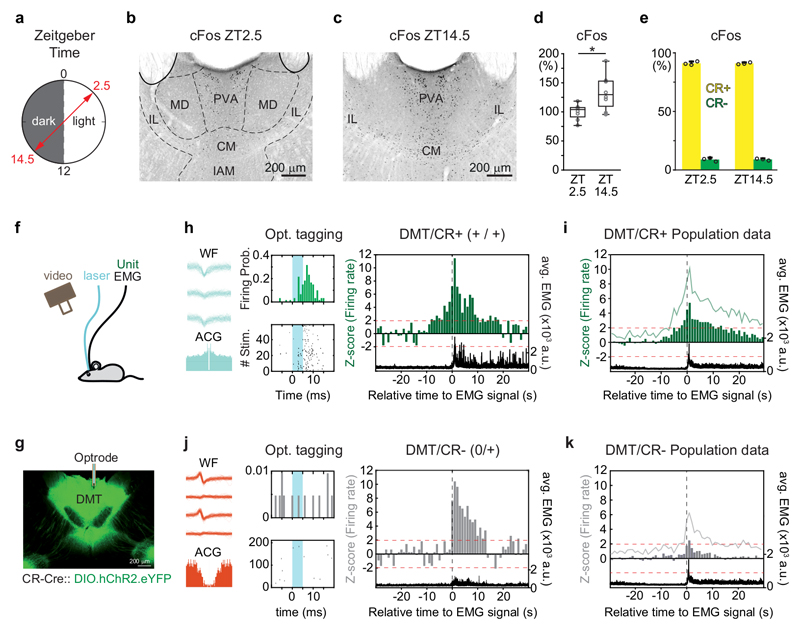
Figure 1. DMT/CR+ cells show arousal-related activation.
a, Experimental setting for cFos immunostaining in DMT at two distinct time points of the dark-light phase according to the Zeitgeber Time (ZT).
b-c, Representative images of cFos expression in DMT at ZT2.5 (dark phase) and at ZT14.5 (light phase).
d, Quantitative data for cFos expression at ZT14.5 normalized to ZT2.5 in DMT (n = 8-8 mice; two-tailed unpaired t-test, t(14) = -2,826, p = 0,0135).
e, Co-localization of CR in cells displaying cFos positivity at ZT2.5 (light phase, n=3 mice, 1140/1253 neurons) and ZT14.5 (dark phase, n=3 mice, 1565/1723 neurons).
f, Schematic drawing for electrophysiological recordings of DMT cells during natural sleep.
g, Confocal image of a coronal section with cannula track (white bar) guiding optrode into the AAV-ChR2-eYFP (green) labeled DMT/CR+ region.
h, Waveforms (WF) in three out of the four tetrode electrodes, autocorrelogram (ACG; left, bottom) and peri-event time histogram upon optogenetic tagging of a DMT/CR+ cell (middle). Right, the same cell started to increase its firing activity preceding the behavioral arousal (black dashed line) by several seconds and maintained elevated firing after the EMG onset as well. ‘+/+, increased activity before/after the arousal; black trace, EMG signal.
i, Population data for the activity of DMT/CR+ at the sleep/wake transition (n = 31 neurons).
j, As in h, for a non-tagged (putative CR-) cell. Note the lack of significant increase in firing activity before the onset of movement.
k, Population data for the activity of DMT/CR- units at the sleep/wake transition (n = 34 neurons). 1 sec bins indicates the averages of z-scores. Green lines, variance (SD) of z-scores; black, averaged EMG signal; black vertical dashed line, EMG onset; red horizontal dashed line, z-score value 1.96 (p < 0.05). Bar graphs are means ± SD; open circles in d and e represent data for single animals; the horizontal lines in the box plots indicate medians, the box limits indicate first and third quantiles, and the vertical whisker lines indicate minimum and maximum values. *p < 0.05. CM, central medial thalamic nucleus; IAM, interanteromedial thalamic nucleus; IL, intralaminar thalamic nuclei; MD, mediodorsal thalamic nuclei; PVA, paraventricular thalamic nucleus, anterior part.

