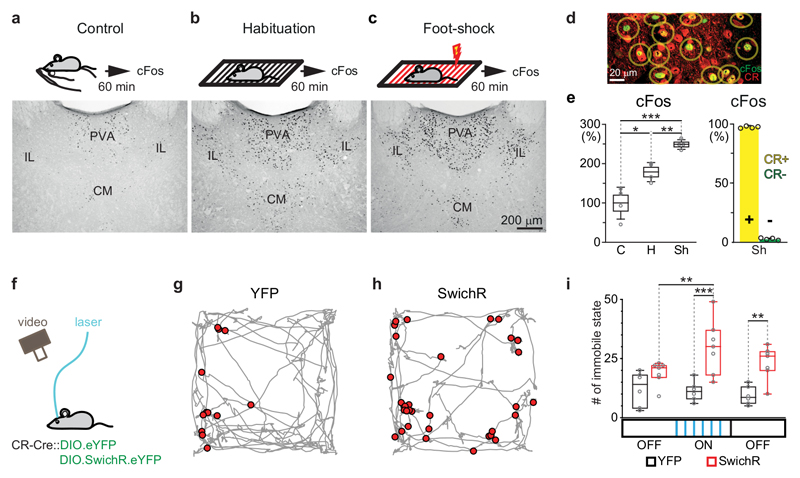
Figure 2. cFos content and optogenetic inhibition of DMT/CR+ cells in situations with distinct arousal levels.
a-c, Schematic drawing of the experimental design (top) and representative images of cFos expressions (bottom) in DMT following handling (a), habituation (no shock); b) and foot shock (c).
d, Representative confocal image of the co-localization of cFos and CR in DMT cells in a foot-shock case.
e, Left, Normalized data for cFos expressing DMT cells in Control (C), Habituation (H) and Shock (Sh) situations (n= 4-4mice; control: 100 ± 40%; habituation: 179 ± 24%, shock: 249 ± 12%; two-tailed unpaired t-test, C vs. H, t(6) = -3,339, p = 0.0156; H vs. Sh, t(6) = -5,152, p = 0.0021; C vs. Sh, t(6) = -7,043, p = 0.0004). Right, CR-content (right) of cFos expressing cells in case of Sh. Yellow bar indicates CR+/cFos+ cells (1393/1433 neurons, 97.2%; n=4 mice), green bar CR-/cFos+ cells (40/1433, neurons, 2.8%).
f, Schematic drawing for optogenetic inhibition of DMT/CR+ in a novel environment.
g-h, Representative data for short immobile states (red dots) evoked by optogenetic silencing during the exploration of a novel box (grey) in a YFP (control, g) and a SwichR-injected mouse (h).
i, Population data for the number of immobile states during the pre-OFF (3 mins), ON (3 mins) and post-OFF (3 mins; see Methods) periods in the YFP (n = 6 mice; pre OFF n = 12.2± 3.0; ON period n = 11.2 ± 1.7, post OFF n = 9.3 ± 1.6) and SwichR-injected animals (n = 7 mice; pre OFF n = 18.9 ± 1.9; ON period n = 29.9 ± 4.4, post OFF n = 23.3 ± 2.7). Repeated-measures ANOVA with Fisher’s LSD, F(2, 22) = 3.4945, p = 0.0481. CM, centromedial thalamic nucleus; IL, intralaminar thalamic nuclei; PVA, paraventricular thalamic nucleus, anterior part. Bar graphs are means ± SD; open circles in e and i represent data for single animals; the horizontal lines in the box plots indicate medians, the box limits indicate first and third quantiles, and the vertical whisker lines indicate minimum and maximum values. *p < 0.05; **p < 0.01, ***p < 0.001.

