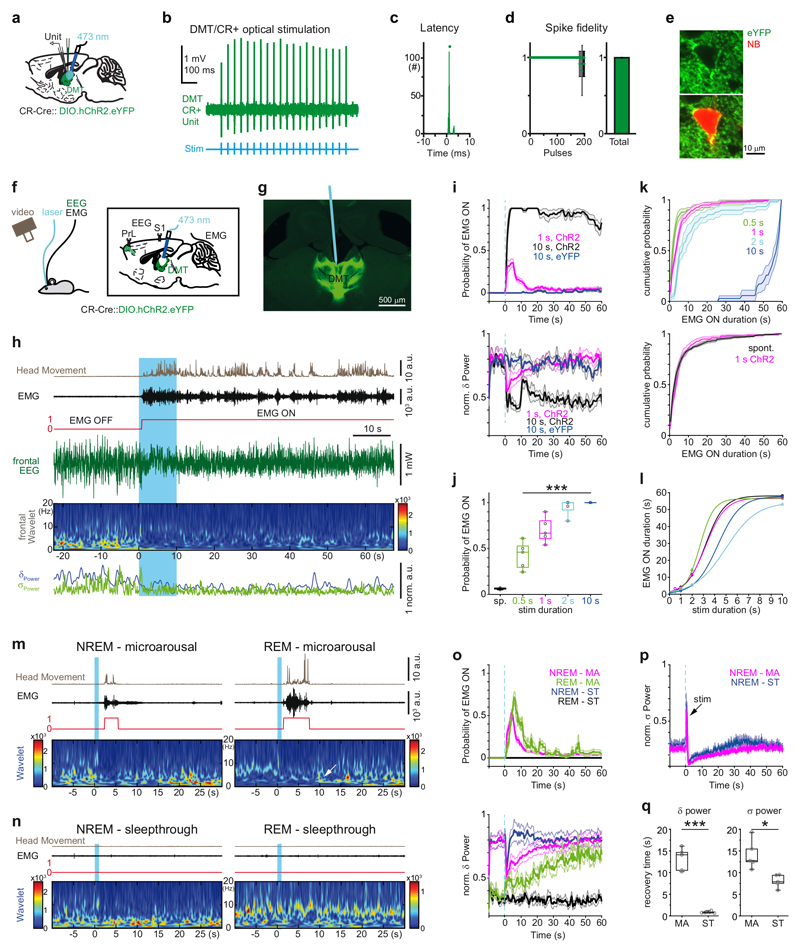
Figure 3. Stimulation of DMT/CR+ induces behaviorally relevant arousal patterns.
a, Experimental setting for anaesthetized in vivo recordings.
b, Optogenetic tagging of a DMT/CR+ cell.
c, Peri-event time histogram of light-evoked spike latency.
d, Spike response probability to 10 sec 20 Hz stimulation (left). Summated values (right).
e, Confocal fluorescent image of an optogenetically tagged, ChR2-eYFP-positive (green) and neurobiotin (red) filled DMT neuron.
f, Experimental setting for in vivo recordings and optogenetic stimulation in freely sleeping mice.
g, Post hoc identification of the optic fiber’s track among ChR2-eYFP-expressing DMT/CR+ neurons.
h, Persistent arousal evoked by 10 sec optogenetic stimulation of DMT/CR+ (blue period).
i, Average (mean) peri-event distribution of EMG ON states (top) and the corresponding delta power (bottom) in mice (n = 8) expressing ChR2 in DMT/CR+ cells after 1 and 10 sec stimulations (red and black, respectively). Data from control (YFP) mice are shown with blue (n = 3). Blue vertical dashed line, onset of the optogenetic stimulation.
j, Average probability of spontaneous and evoked arousal using different stimulus durations (n = 5 mice, spontaneous (sp), 0.06 ± 0.01; 0.5 sec, 0.43 ± 0.15; 1 sec, 0.70 ± 0.14; 2 sec, 0.95 ± 0.09; 10 sec, 1.00 ± 0; Repeated measures of ANOVA for evoked trials, F(3,12) = 34.307, p < 0.0001; pairwise comparison with Bonferroni correction shows significant difference only for 0.5 sec vs 1 sec, p = 0.017; 0.5 sec vs 2 sec, p = 0.019; 0.5 sec vs 10 sec, p = 0.006).
k, Cumulative probability distribution of the duration of EMG ON states in case of 0.5, 1, 2, and 10 sec stimulations (n = 5 mice) (top). Comparison of spontaneous and evoked microarousals (1 sec stimulation, bottom): 3.69 ± 1.31 sec for evoked and 3.23 ± 1.27 sec for spontaneous, n = 8 mice; two-tailed paired t-test for group data, t(7) = -1.82, p = 0.111; Kolmogorov-Smirnov test for animal-wise comparison, p > 0.05; in 7/8 animal).
l, Correlation of stimulus durations and arousal lengths in five individual animals fitted with sigmoid.
m, Microarousals during NREM (left) and REM (right) states evoked by 1 sec long stimulation of DMT/CR+ cells. Note the state change from REM to NREM after REM microarousals indicated by the appearance of high values in the delta range (white arrow).
n, Subthreshold stimulations (sleep-through) during NREM (left) and REM (right) states.
o, Average (mean) peri-event distribution of EMG ON states (top) and delta power (bottom) in case of microarousals (MA) and sleep-throughs (ST) during NREM and REM states (n = 5 mice). Note longer microarousals in REM (green, top), the return of NREM after REM MA indicated by the increasing delta values. Note also the rapid return of delta power in case of NREM-ST (bottom).
p, Prolonged disruption of sigma band both in case of microarousals MA and sleep-through. The sharp peak at time 0 (black arrow) represents the evoked response of 10 Hz stimulation in the frontal cortex.
q, Recovery time constants for delta and sigma powers in case of NREM microarousals and sleep-throughs (n = 5 mice, Delta-MA, 13.12 ± 2.34 sec; Delta-ST, 0.85 ± 0.23 sec; two-tailed paired t-test t(4) = 11.116, p < 0.0001 and Sigma-MA, 14.14 ± 2.98 sec; Sigma-ST, 8.03 ± 1.32 sec ; two-tailed paired t-test t(4) = 4.114, p = 0.015).
The horizontal lines in the box plots indicate medians, the box limits indicate first and third quantiles, and the vertical whisker lines indicate minimum and maximum values. *p < 0.05; ***p < 0.001. Shaded areas represent ± s.e.m.

