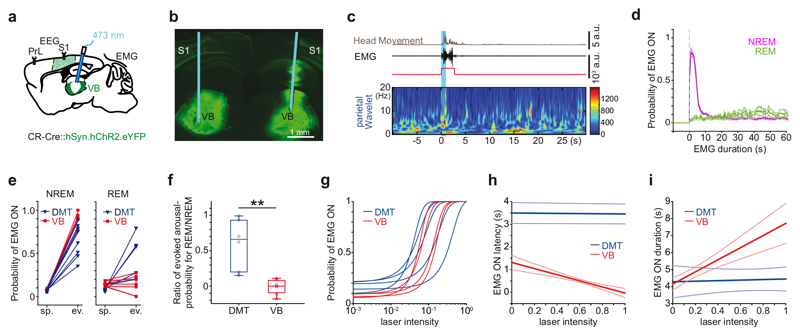
Figure 4. Microarousals evoked by DMT/CR+ cells and sensory nuclei.
a, Schematic diagram for the experimental settings.
b, Position of the optic fiber in a coronal section of VB expressing ChR2-eYFP.
c, Microarousal during NREM (left) evoked by 1 sec long stimulation of VB cells.
d, Average (mean) peri-event distribution of EMG ON states shows high probability during NREM (purple; 0.91 ± 0.07, n = 7 unilateral stimulation from 4 mice). VB stimulation was ineffective in REM sleep (green) in response to 1 sec stimulation (blue dashed line). Shaded area represents ± s.e.m.
e, Spontaneous and evoked rate of microarousal induced by 1 sec stimulation of DMT/CR+ (blue) or VB (red) in NREM (left) and REM (right) sleep.
f, Arousal probability in REM normalized to arousal probability in NREM for DMT/CR+ (blue) and VB mice (red). (VB, n = 7; DMT, n = 6; 2*one-tailed Mann-Whitney, p = 0.0011). The horizontal lines in the box plots indicate medians, the box limits indicate first and third quantiles, and the vertical whisker lines indicate minimum and maximum values. The whiskers extend to the most extreme data points.
g, Correlation of laser intensity and arousal probability. Sigmoid was fitted for each animal. To enable comparison of sigmoid slopes between groups, both laser intensities and arousal probabilities were normalized to their maximal values within each mouse. The slope of sigmoid curves showed individual variability, but on average, there was no significant difference between VB and DMT/CR+ animals (VB, n = 4, DMT n = 5 mice; 2*one-tailed Mann-Whitney, p = 0.142).
h, Correlation of laser intensity vs. microarousal latency. dMT-latency: r = -0.05+-0.11; p: n.s in n= 4/5 animals, individual p values: p = 0.023; p = 0.371; p = 0.476; p = 0.57; p = 0.476; VB latency: r = -0.275+-0.09, n= 4 hemisphers, individual p values: p = 0.0028; p = 0.0005; p = 0.0001; p = 0.0001.
i, Correlation of laser intensity vs. microarousal duration. DMT duration: r = 0.01+-0.07; p: n.s in n = 5 animals; individual p values: p = 0.28; p = 0.35; p = 0.59; p = 0.60; p = 0.85. VB-duration: r = 0.2+-0.05; in n = 4 hemispheres, individual p values: p = 0.034; p = 0.001; p = 0.0005; p = 0.0001. Thin blue and red lines represents ± s.e.m.

