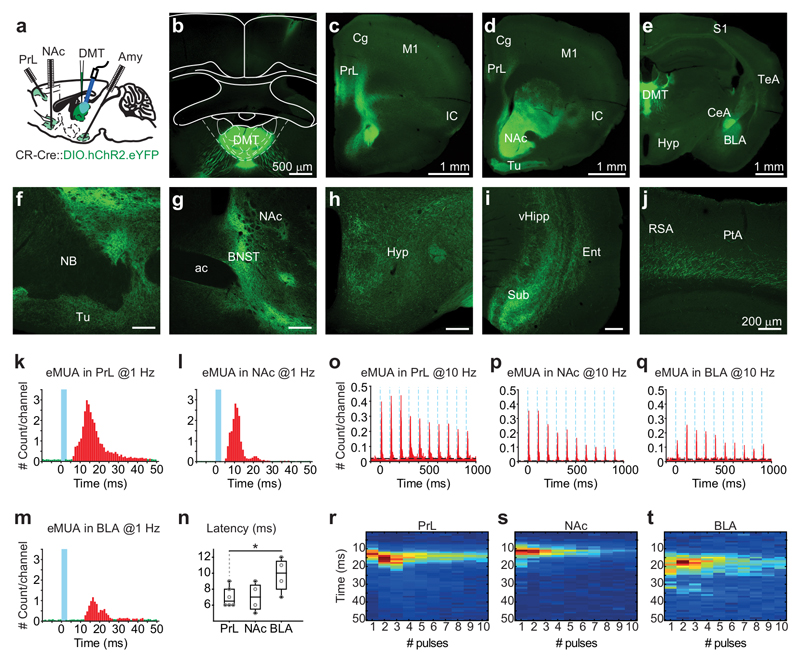
Figure 5. Functional connectivity of DMT/CR+ cells.
a, Experimental setting for simultaneous in vivo multiunit recordings from three target regions of DMT/CR+.
b-j, Distribution of DMT/CR+ axons in the mouse forebrain. Injection site of AAV-DIO-ChR2-eYFP in DMT of a CR-Cre mouse (in b). Similar data were obtained in 29 mice.
k-m, Normalized peri-event time histogram of evoked MUA (eMUA) responses in PrL (k), NAc (l) and BLA (m) at 1 Hz light stimulation of DMT/CR+ (blue line). Bins in red are significantly larger than baseline (green).
n, Population data for latencies of eMUA in PrL (7 ± 1.26 ms, n = 6), NAc (7 ± 1.83 ms, n = 4) and BLA (9.75 ± 2.22 ms; n = 4; two-tailed unpaired t-test, PrL vs. BLA, t(8) = -2,526, p = 0.0354).
o-q, Normalized peri-event time histogram of eMUA responses in PrL (o), NAc (p) and BLA (q) at 10 Hz light stimulation (blue dotted lines) of DMT/CR+.
r-t, Normalized heat map showing peak latencies of eMUA at 10 Hz in PrL (r), NAc (s) and BLA (t). The horizontal lines in the box plots indicate medians, the box limits indicate first and third quantiles, and the vertical whisker lines indicate minimum and maximum values. *p < 0.05. ac, anterior commissure; Amy, amygdala; BLA, basolateral amygdala; BNST, bed nucleus of the stria terminalis; CeA, central amygdala; Cg, cingulate cortex; DMT, dorsal medial thalamus; Ent, entorhinal cortex; Hyp, hypothalamus; IC, insular cortex; M1, primary motor cortex; NAc, n. accumbens; NB, nucleus basalis; PrL, prelimbic cortex; PtA; parietal association cortex; RSA, retrosplenial agranular cortex; S1, primary somatosensory cortex; Sub, subiculum; TeA, temporal association cortex; Tu, olfactory tubercle; vHipp, ventral hippocampus.

