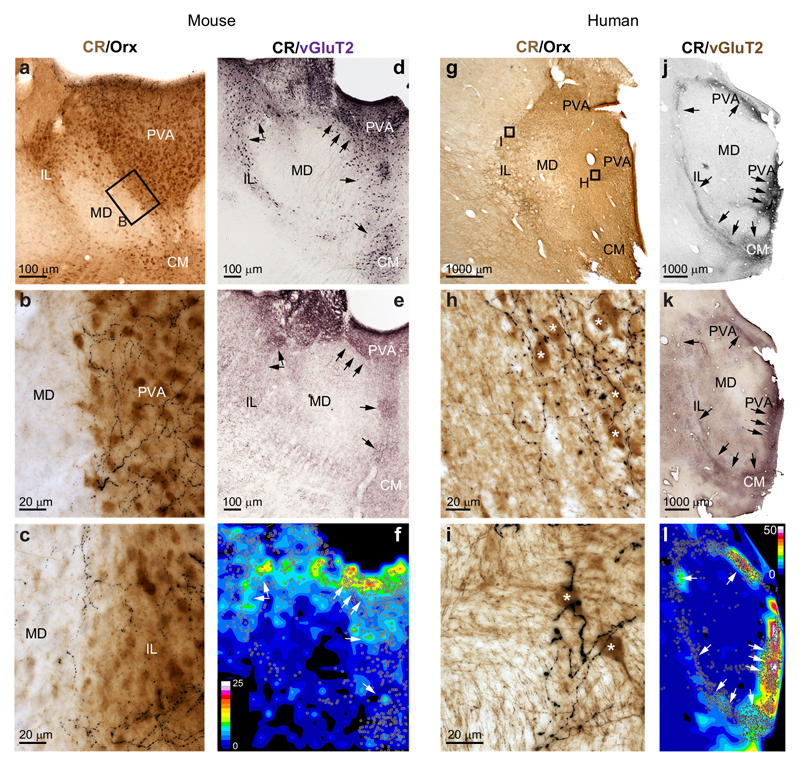
Figure 7. Selective subcortical innervation of DMT/CR+ cells in mice and human.
a, Low-power double immunostaining of mouse DMT for CR (brown) and orexin (Orx, black) (n = 4 mice). Small box represents the enlarged area in b.
b-c, High power images from the midline (b) and intralaminar (c) regions. Note that the orexin-positive fibers are restricted to regions populated by CR+ cells.
d-e, Low power immunostaining for CR (d) and vGluT2 (e) of the mouse DMT. f, Heat-map representing staining density shows large overlap between vGlut2 terminals and the position of CR+ cell bodies in the midline and dorsal intralaminar region.
g-i, Same images as a-c in the human thalamus (n = 4 humans). Small boxes indicate the position of high power images.
j-l, Same images as d-f in the human thalamus. Scale of the density map: 0-25 bouton/1000 μm2 (mouse) and 0-50 bouton/1000 μm2 (human). CM, central Medial thalamic nucleus; IL, intralaminar thalamic nuclei; MD, mediodorsal thalamic nuclei; PVA, paraventricular thalamic nucleus, anterior part.

