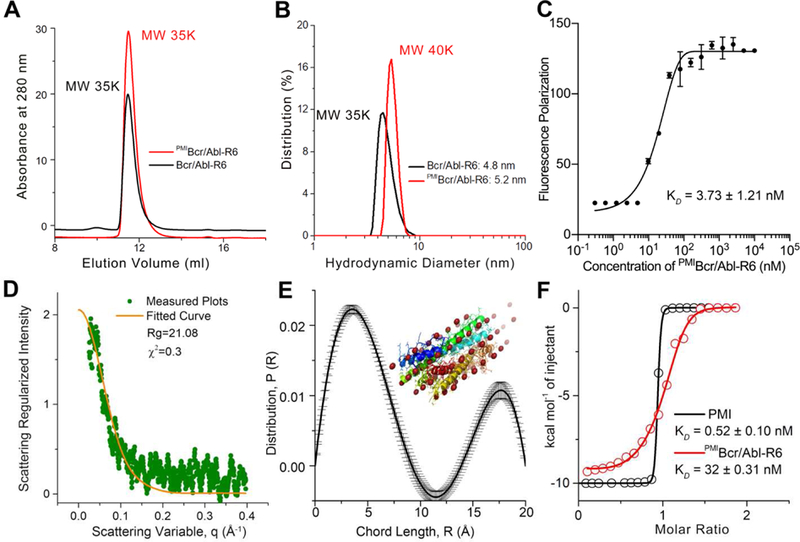
Fig 3. Biochemical and biophysical characterization of PMIBcr/Abl-R6.

(A) Size exclusion chromatography of Bcr/Abl-R6 (black) and PMIBcr/Abl-R6 (red) performed on a GE Superdex 75 column (10/300 GL) running PSB at a flow rate of 0.5 ml/min at room temperature. The apparent molecular weights of Bcr/Abl-R6 and PMIBcr/ABL-R6 were calculated according to the standard calibration curve shown in Fig. S2, indicating that they exist in aqueous buffer as tetramers. (B) Dynamic light scattering analysis of Bcr/Abl-R6 (black) and PMIBcr/Abl-R6 (red) at 20 µM in PBS performed on a Malvin Zetasizer Nano system. The apparent molecular weights were calculated using manufacturer-supplied software. (C) Monomer-tetramer equilibrium of serially diluted PMIBcr/Abl-R6 (from 10 µM to 0.3 nM in 20 mM Tris/HCl, pH 7.4) measured in 386-well black plates by fluorescence polarization, yielding a KD value of 3.73±1.21 nM (KD=(monomer)4/(tetramer), where the concentrations of monomeric and tetrameric PMIBcr/Abl-R6 were derived from fluorescence polarization values). PMIBcr/Abl-R6 was N-terminally labeled with a fluorophore, BDP TR (Excitation 589 nm, Emission 616 nm). (D) Small angle X-ray scattering (SAXS) diffractograms of PMIBcr/Abl-R6 measured at 20 µ M in PBS. The orange line is the least squares fit to the data (green points) using a rod model. (E) SAXS analysis of PMIBcr/Abl-R6 at 10 µM in PBS at room temperature. The chord length distribution that describes the size, shape and spatial arrangement of PMIBcr/Abl-R6 was obtained from SAXS data. The simulated structure of PMIBcr/Abl-R6 is largely in agreement with the crystal structure of tetrameric Bcr/Abl (PDB code: 1K1F [34]) (inset). (F) Measurements of the binding affinity of PMI and PMIBcr/Abl-R6 for MDM2 in 20 mM Tris/HCl, pH 7.4, by isothermal titration calorimetry on a MicroCal ITC 200 instrument at 25 °C. Titrations were carried out by 20 stepwise injections, 2 µL at a time, of 80 µM PMIBcr/Abl-R6 in the syringe to 8 µM MDM2 in the cell. For the PMI-MDM2 interaction, the concentrations were 100 µM and 10 µM, respectively. Data were analyzed using the MicroCal Origin program. The KD value of 0.52 nM, measured as described [39], is nearly identical to the published value of PMI determined by surface plasmon resonance [38]. Values of enthalpy change, ∆H, entropy change, ∆S, and binding stoichiometry, n are listed in Table S1.
