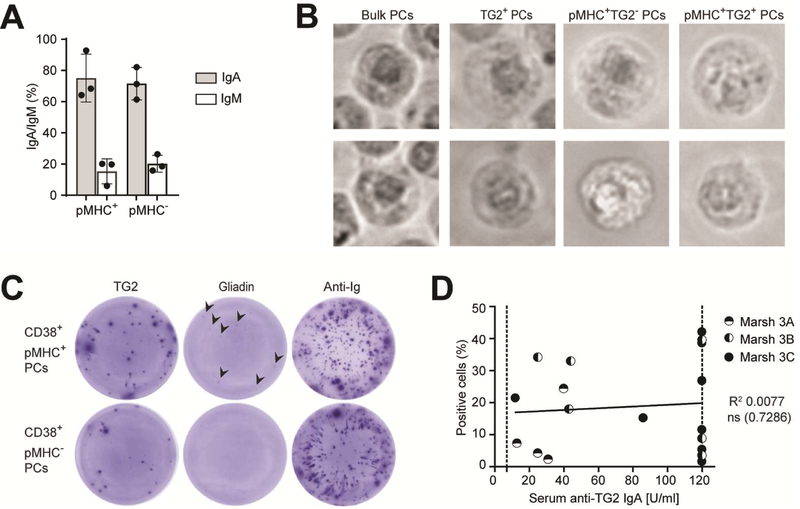
Figure 5.
DQ2.5-glia-α1a presenting plasma cells express TG2-and gliadin-specific IgA. (A) Expression profile of surface IgA and IgM BCR on CD38+ plasma cells staining as pMHC+ or pMHC-(HLA-DQ2.5+ UCD patients with Marsh 3B/C, n=3). Error bars illustrate mean ± SD. (B) Representative micrographs of FACS-sorted plasma cell subsets as indicated (HLA-DQ2.5+ UCD patients with positive serum anti-TG2 IgA titers and with Marsh 3B/C, n=3). Two individual cells within each group are shown. (C) TG2 and gliadin ELISPOT on FACS sorted pMHC+ or pMHC-CD38+ plasma cell subsets as indicated (HLA-DQ2.5+ UCD patients with Marsh 3B/C, n=2). TG2-and gliadin-specific IgA antibodies were detected using AP-conjugated anti-IgA Ab. (D) Percentage of HLA-DQ2.5:DQ2.5-glia-α1a detection within CD19+ plasma cells does not correlate with serum anti-TG2 IgA titer (n=18). Each data point represents an individual subject and the Marsh score is indicated. The dotted line indicates upper and lower thresholds for antiTG2 IgA detection (7 and 120, respectively). The line is derived from linear fitting; R2 and twotailed P-values of IgA anti-TG2 antibody value (Pearson correlation); ns=not significant. (B,C) PCs, plasma cells.

