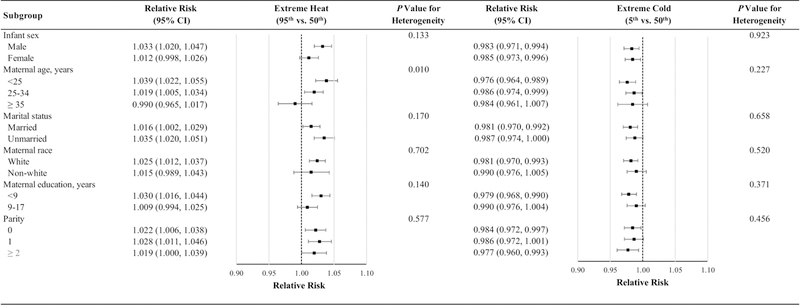
Fig. 3. Relative risks of preterm birth associated with temperature extremes over the subsequent four days by individual characteristics.
Abbreviations: CI, confidence interval.
Models were adjusted for long-term and seasonal trends using a natural cubic spline of time with 8 degrees of freedom per year, relative humidity using a natural cubic spline with 3 degrees of freedom, day of the week, federal holidays, and the temporal variation of the daily expected count of preterm births.

