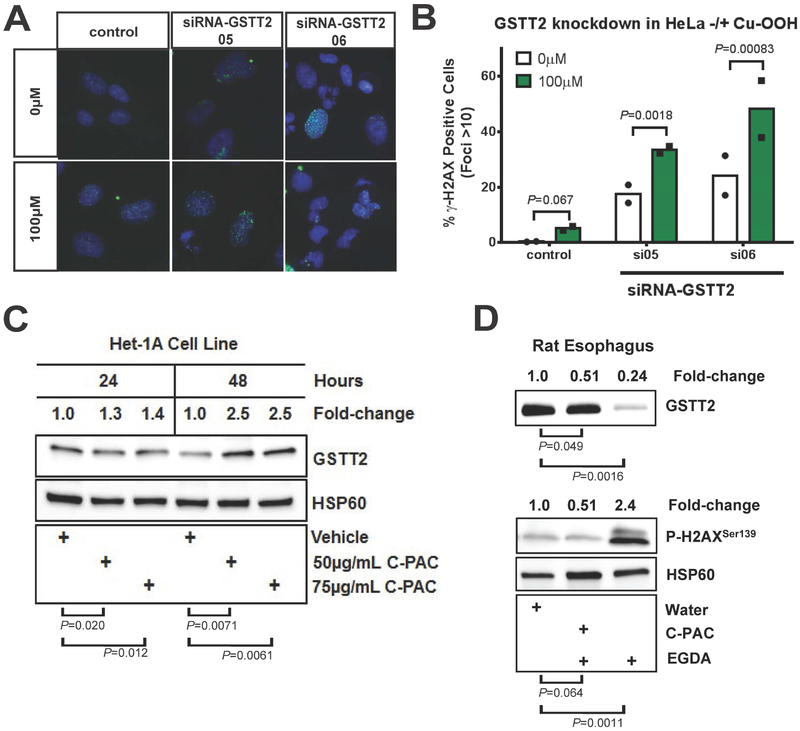
Fig. 4. Effect of GSTT2 knockdown, cum-OOH and cranberry proanthocyanidin extract (C-PAC) on GSTT2 expression and DNA damage response.
(A-B) Quantification of γ-H2AX positive foci in Het-1A, with and without GSTT2 specific siRNA knockdown. Nuclei with >10 γ-H2AX-stained foci considered as positive for DNA damage, for duplicate experiments. Analyses were modelled as a 4-way ANOVA with terms of cum-OOH (0 vs 100μM), cell type (Het-1A vs HeLa), treatment (control, siRNA05, siRNA06) and experiment day, as detailed in Supplementary Methods. In Het-1A both GSTT2 siRNA knockdowns dramatically increased the response to cum-OOH. Contrasts between 0μM Cum-OOH treatments were P=0.026 and P=0.14 for control to siRNA05 or siRNA6, respectively, and P=0.34 for siRNA05 to siRNA06, with 7-20% more cell showing damage. Both siRNAs gave significantly more foci than control (P=3.9E-05 and 2.9E-05, respectively) at 100μM Cum-OOH, but were not different from each other (P=0.83). (C) Western blot of Het-1A showing that treatment with C-PAC induces GSTT2 protein. Log2 ratios (GSTT2 vs HSP60) for 24 and 48hr time points were used in separate 2-way ANOVA models, each with terms for experiment (triplicate ratios) and C-PAC treatments. Unadjusted vehicle vs treatment group comparison P values are shown, while between treatment (50 vs 75 μg/mL C-PAC) comparisons were not significant (P=0.58 and P=0.84 for 24 and 48hr time points respectively). (D) Western blot showing that C-PAC mitigation of GSTT2 loss coincides with protection against the DNA damaging effects of gastroduodenal reflux in an esophagogastroduodenal anastomosis (EGDA) rat model, with relative esophageal protein levels of GSTT2 and γ-H2AX contrasted with and without C-PAC treatment. Log 2 ratios (HSP60 as reference) for GSTT2 and γ-H2AX were used in separate 2-way ANOVA models, each with terms for experiment (triplicate ratios) and treatment groups. Unadjusted water vs treatment group comparison P values are shown. EGDA rats with C-PAC had significantly more GSTT2 (P=0.00041) and less γ-H2AX foci (P=0.0088) than EGDA rats not given C-PAC.

