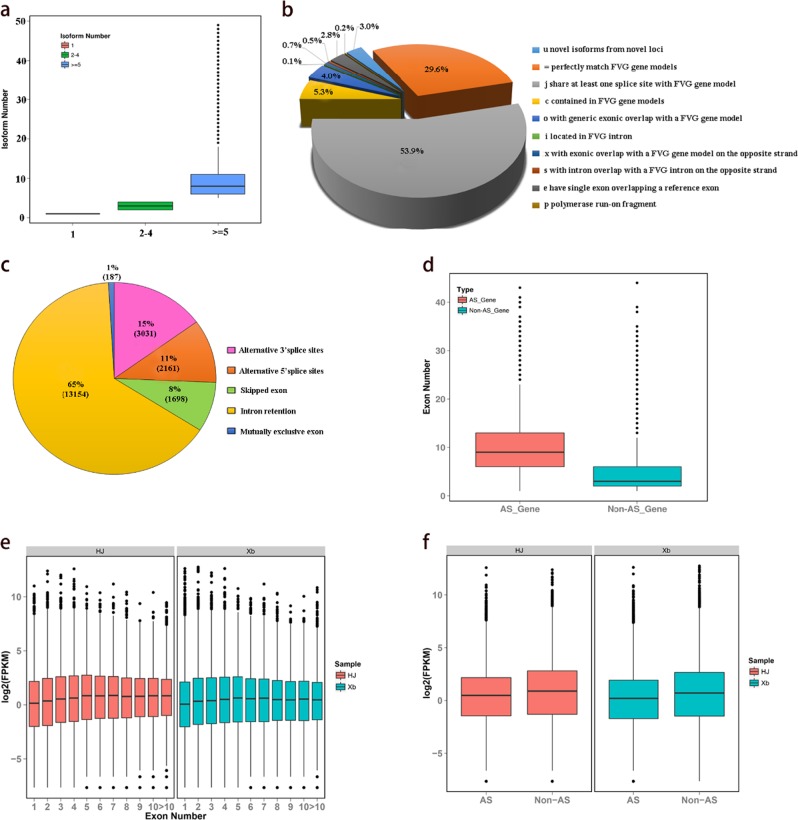
Fig. 1. Identification and characterization of isoforms and alternative splicing.
a Boxplot showing the percentage of Fragaria vesca loci mapped with different numbers of SMLR isoforms. b Comparison of SMLR isoforms with Fragaria vesca Genome v4.0.a1 by Cuffcompare. c Pie chart showing the number and percentage of AS events obtained from the SMRT. d Boxplot showing the exon numbers of AS and non-AS genes in SMRT. e. Boxplot showing the expression levels of SMRT isoforms with a different number of exons in the ripe strawberry fruit of two varieties (HJ and Xb). f. Boxplot showing the expression levels of AS and non-AS genes in the ripe strawberry fruit of two varieties (HJ and Xb)

