
Fig. 4. Scatter plot of crown size and the natural logarithm of λ for 145 bushes.
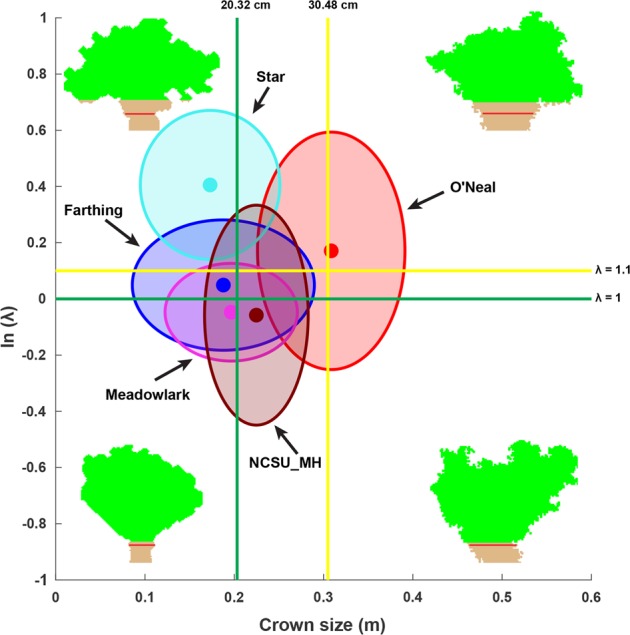
Green (or yellow) axes indicate the value limits of crown size and path curve λ for bushes well suited to (or acceptable for) mechanical harvesting. Solid circles represent the center of individual clusters. For each representative bush, green and brown colors are used to render the canopy and non-canopy parts, and the red line in each bush silhouette indicates the height where the crown size was measured