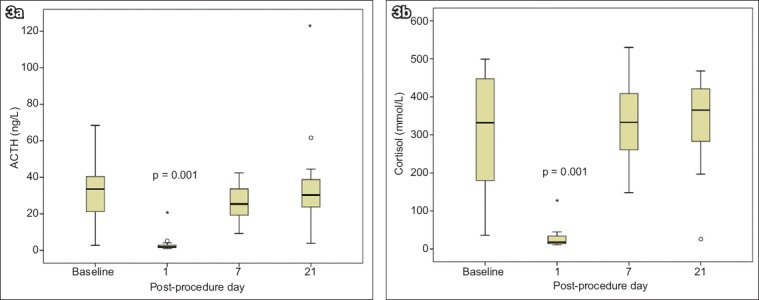
Fig. 3.

Charts show (a) distribution of serum adrenocorticotropic hormone (ACTH); and (b) distribution of serum cortisol at various time-points, with p = 0.001 at one day post procedure versus baseline. * and ° represent extreme and outlier values, respectively. One outlier patient with markedly lower baseline serum ACTH and cortisol levels compared to other patients was excluded from Fig. 3 but included in all analyses.
