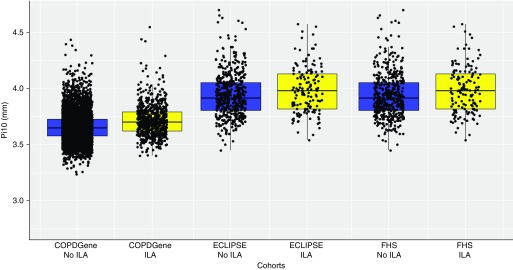
Figure 1.
The median, minimum, maximum, and first and third quartiles (bottom and top of boxes) of the square root of airway wall thickness (in mm) of hypothetical airways with internal perimeter of 10 mm (Pi10) are shown for each cohort, with individual data points superimposed. Blue boxes represent subjects without interstitial lung abnormalities (ILA), and yellow boxes represent subjects with ILA. COPDGene = Genetic Epidemiology of COPD; ECLIPSE = Evaluation of COPD Longitudinally to Identify Predictive Surrogate Endpoints; FHS = Framingham Heart Study.

