
Supplemental figure S2.
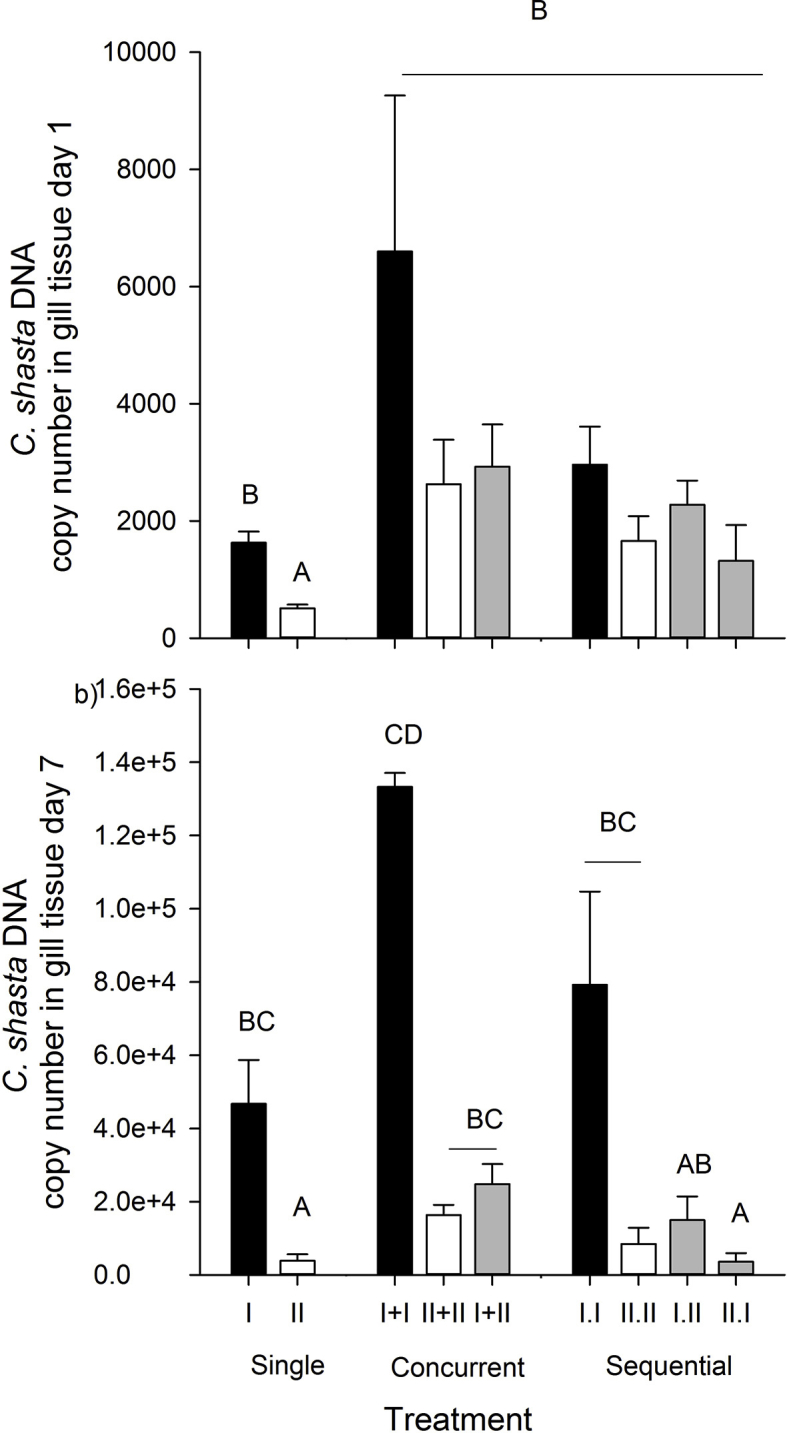
Total Ceratonova shasta DNA copy number in gill tissue sampled at 1d (t7) post exposure. Black bars denote genotype-I only, white denote genotype-II only, and grey denote mixed-genotype treatments. Letters indicate treatments that differed (Tukey's HSD tests, α = 0.05).