Figure 1.

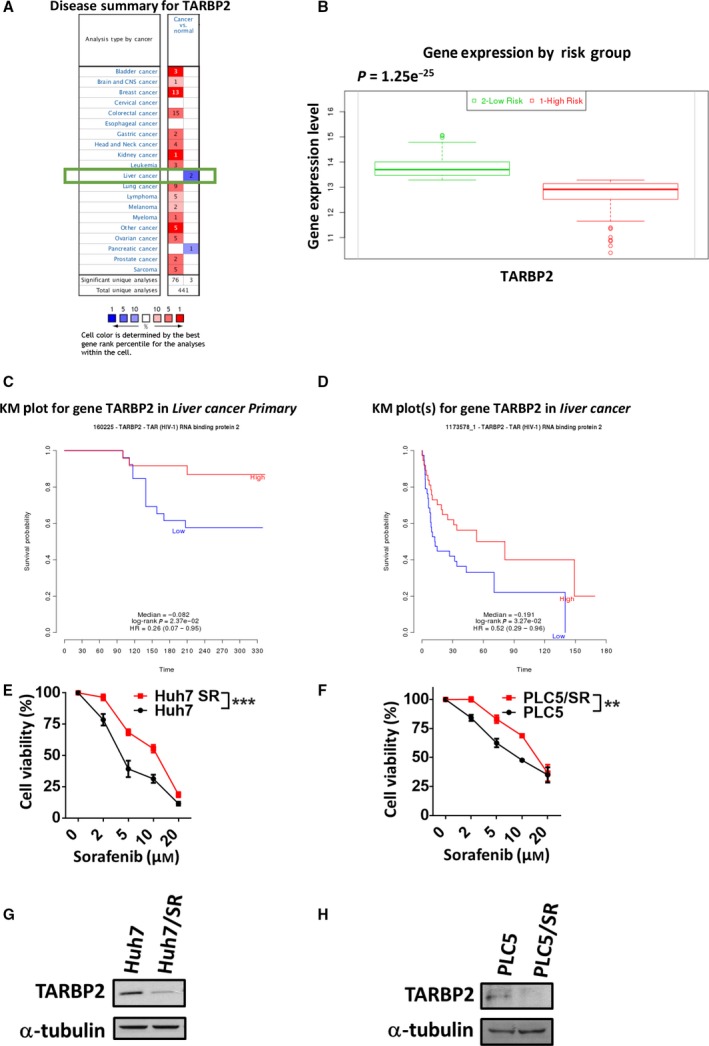
Downregulation of TARBP2 correlates with a poor outcome of patients with HCC and facilitates SR in HCC cells. (A) TARBP2 mRNA expression data were collected from the Oncomine database with thresholds of a P value ≤ 0.01 and gene rank ≤ 10%. The numbers in the colored cells represent the number of analyses. The red cells indicate increased TARBP2 mRNA expression in tumor tissues; the blue cells indicate reduced TARBP2 mRNA expression in tumor tissues. (B) The prognostic index of TARBP2 in 162 liver cancer patients was analyzed from the SurvExpress database and categorized into low‐ and high‐risk groups (x‐axis). The expression of TARBP2 is presented along the y‐axis. (C, D) Kaplan–Meier curves were generated from the PRECOG database. The data were collected from groups of 50 (GSE364; C) and 91 (GSE1898; D) liver cancer patients. (E, F) Expression of TARBP2 in paired HCC cell lines. Huh7 and Huh7/SR (E) or PLC5 and PLC5/SR (F) cells were treated with the indicated concentrations of sorafenib for 48 h. Cell viability was measured using the MTT assay. Data are presented as mean ± SEM, with at least n = 3 per group. Multigroup comparisons were analyzed by two‐way ANOVA with Tukey's post hoc test. P values < 0.05 were considered statistically significant. **P < 0.01; or ***P < 0.005. (G and H) The expression of TARBP2 in Huh7 (G) and PLC5 (H) cells was determined via western blot analysis.
