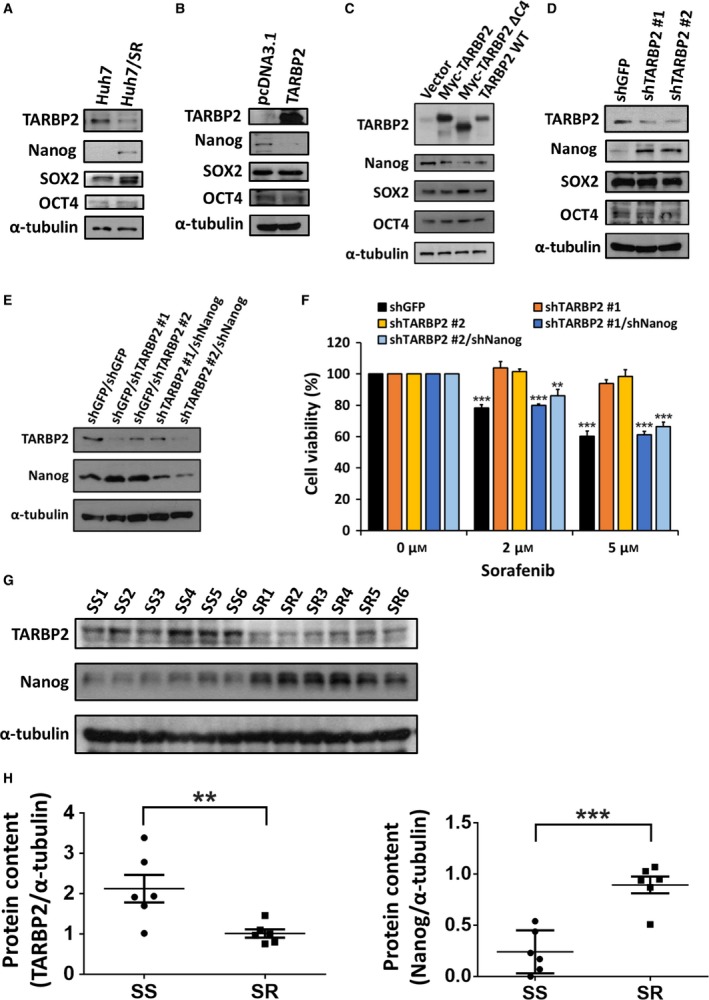
Figure 5.

Downregulation of TARBP2 increases Nanog protein levels to promote SR. (A–D) The protein expression of Nanog, SOX2, and OCT4 in paired HCC cells was analyzed via western blot analysis (A). TARBP2 (B) or TARBP2 ΔC4 (C) was overexpressed in Huh7/SR cells for 48 h. TARBP2 was knocked down in Huh7 cells (D). TARBP2 and CSC markers were quantified via western blot analysis. (E, F) Effect of TARBP‐mediated Nanog downregulation on SR. TARBP2 and Nanog were co‐knocked down in Huh7 cells. TARBP2 and Nanog protein levels were determined via western blot analysis (E). The stable clones were treated with the indicated concentrations of sorafenib for 48 h. Cell viability was measured using the MTT assay (F). Data are presented as mean ± SEM, with at least n = 3 per group. (G, H) The protein lysates were homogenized from SS and SR tumor tissues (n = 6, G). TARBP2 and Nanog expression were analyzed by western blot analysis. TARBP2 and Nanog expression were normalized to α‐tubulin to quantify the protein content by using imagej software (National Institutes of Health, Bethesda, MD, USA) (H). Multigroup comparisons were analyzed by one‐way ANOVA with Tukey's post hoc test. P values < 0.05 were considered statistically significant. **P < 0.01; ***P < 0.005.
