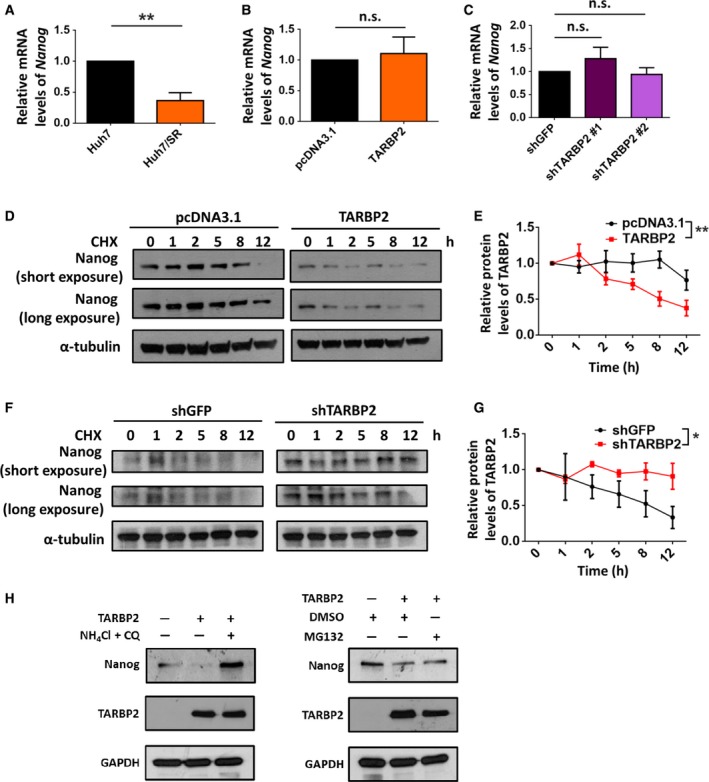
Figure 6.

TARBP2 expression reduces Nanog protein stability. (A–C) Effect of TARBP2 on the mRNA expression of NANOG. CSC markers and NANOG mRNA expression in paired HCC cells were analyzed via real‐time PCR (A). TARBP2 was overexpressed in Huh7/SR cells for 48 h (B). TARBP2 was knocked down in Huh7 cells (C). NANOG mRNA expression was analyzed using real‐time PCR. Multigroup comparisons were analyzed by one‐way ANOVA with Tukey's post hoc test. (D–G) Effect of TARBP2 expression on Nanog protein stability. TARBP2 was overexpressed in Huh7/SR for 48 h. The cells were treated with CHX (100 μg·mL−1) for the indicated time periods (D). TARBP2 was knocked down in Huh7 cells. The cells were treated with CHX (100 μg·mL−1) for the indicated time periods (F). The relative quantity of the depicted proteins was analyzed through three independent experiments (E, G). (H) Effects of the proteolytic pathways on TARBP2‐mediated Nanog downregulation in Huh7 cells. TARBP2 was overexpressed in Huh7 cells for 24 h. The cells were treated with NH 4Cl (10 mm) and CQ (200 μm) for 48 h or with MG132 (5 μm) for 24 h. Data are presented as mean ± SEM. Data are presented as the mean ± SEM from at least three independent experiments. Multigroup comparisons were analyzed by two‐way ANOVA with Tukey's post hoc test. P values < 0.05 were considered statistically significant. *P < 0.05; **P < 0.01.
