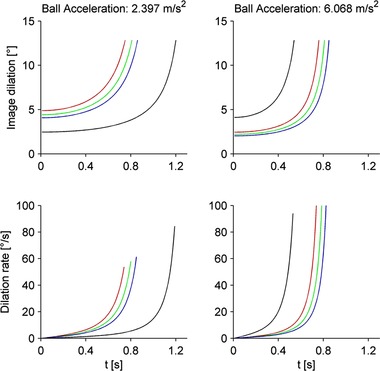
Figure 4. Changes of image dilation and dilation rate.

Time course of changes of image dilation (top) and dilation rate (bottom). Red, green and blue curves correspond to target motion durations of 0.75, 0.8 and 0.85 s, respectively. Black curves correspond to durations of 0.534 and 1.193 s for ball acceleration of 6.068 and 2.397 m s–2, respectively. [Color figure can be viewed at wileyonlinelibrary.com]
