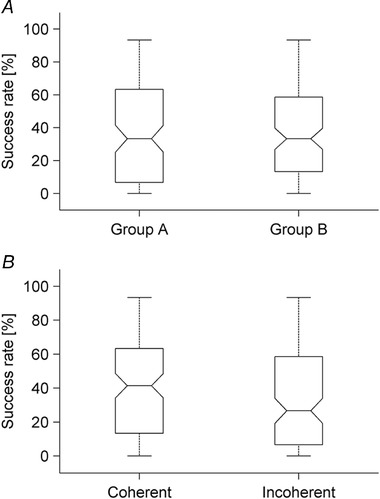
Figure 5. Interception success rate in the between‐groups protocol.

A, results plotted separately for each group of participants, group A and B tilted by 20° and 60°, respectively (20 participants × three motion durations × two ball accelerations in each group). B, results plotted separately for the conditions coherent or incoherent with physics (40 participants × three motion durations in each plot). In the box‐and‐whisker plots, the bottom and top of the boxes correspond to the lower and upper quartile, respectively, and define the IQR. The notch displays the 95% CI of the median and the whiskers extend to the lowest and highest data points.
