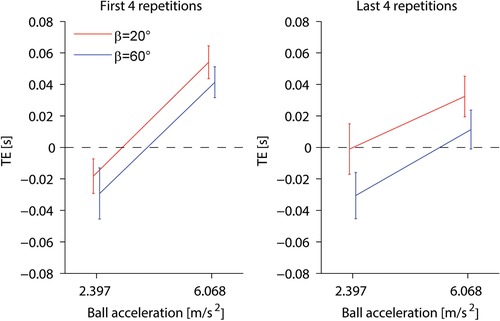
Figure 7. Comparison of TE repetitions.

Comparison of TE averaged over the first four repetitions (left) with TE averaged over the last four repetitions (right) in the between‐groups protocol. Mean TE (± 95% confidence interval over all 20 participants) for subjects tilted by 20° and 60° are shown in red and blue, respectively. Only trials with the three motion durations matched across target accelerations are included. [Color figure can be viewed at wileyonlinelibrary.com]
