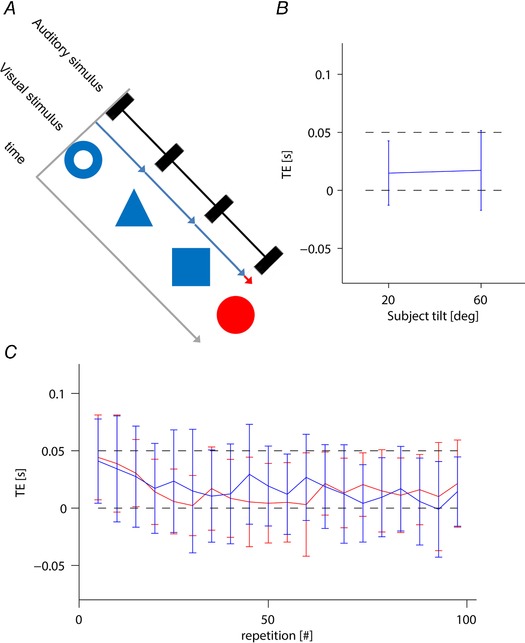
Figure 11. Control experiment.

A, stimuli. The predictable series of stationary images (visual stimulus) and beeps (auditory stimulus) presented to participants. The blue and red arrows indicate the display duration of corresponding object. Participants were asked to hit the static target sphere (the last object of the sequence) in synchrony with the last of the predictable series of beeps. B, mean TE (± 95% confidence interval over all 20 participants) for subjects tilted by 20° and 60°. C, mean TE as a function of repetition for subjects tilted by 20° and 60° (red and blue, respectively). For clarity, each data point represents the average (± 95% confidence interval over all 20 participants) of five consecutive trials. In (B) and (C), black dashed lines represent the theoretical margin of error corresponding to the duration of the target sphere (0–50 ms). [Color figure can be viewed at wileyonlinelibrary.com]
