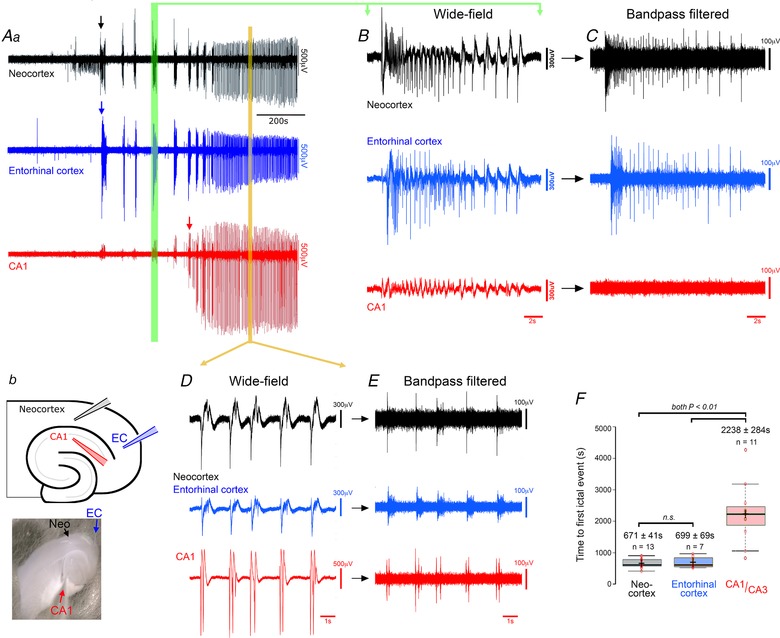
Figure 1. Typical pattern of evolving epileptiform activity following wash‐out of Mg2+ ions from the bathing media (0 Mg2+ model), showing delayed recruitment of hippocampal circuits relative to neocortex.

Aa, extracellular recordings (broad band), showing typical pattern of evolving epileptiform activity following washing out of Mg2+. The arrows indicate the first full ictal events, as indicated by intense multiunit (high frequency) activity, in the three recordings. b, schematic representation and photomicrograph of a horizontal brain slice, showing the locations of three extracellular recording electrodes in hippocampus (CA1, red), the entorhinal cortex (EC, blue) and deep layers of the neocortex (NC, black). B, broad band signals show small deflections in the hippocampal field at the time of large neocortical discharges during early ictal‐like events (green vertical bar in A), but high pass filtering (C) shows that these hippocampal signals are not associated with any significant unit activity. D and E, similar broad band (D) and high pass filtered (E) expanded views of a representative period of late‐stage activity (orange bar in panel A). Note that the prominent high frequency component indicative of local network firing, is now seen at all three electrode sites. F, boxplot illustrating the pooled data, showing a highly significant delay of the earliest hippocampal epileptiform discharges relative to the first neocortical or entorhinal discharges (ANOVA F [2,28] = 25.76, P = 4.5 × 10⁻⁷). The results of individual comparisons (post hoc Tukey test) and the sample sizes (different brain slices; these are not paired recordings) are shown above the data distributions. [Color figure can be viewed at wileyonlinelibrary.com]
