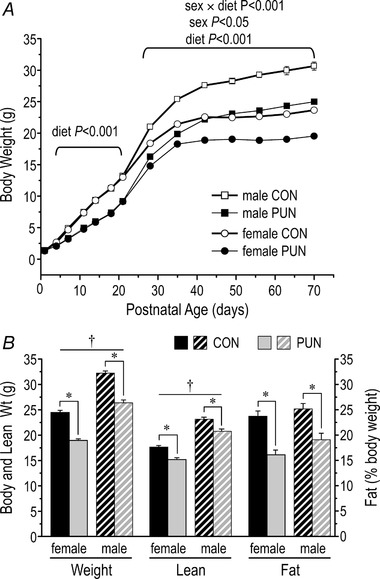
Figure 2. Body weight growth curves and body composition of CON and PUN female and male mice.

A, average body weight of individual male and female mice from birth to 70 days of age (PN70). Body weight was reduced in PUN mice compared to CON starting at PN4, with no sex difference until PN28, after which males were significantly heavier than females within each dietary group; n = 17 litters/group; values are means ± SE. B, body weight, lean mass, and fat (% of body weight) at PN70 of male and female CON and PUN mice. Values are mean ± SEM. * P < 0.001 for CON vs. PUN; † P < 0.001 for male vs. female; diet × sex, n.s.).
