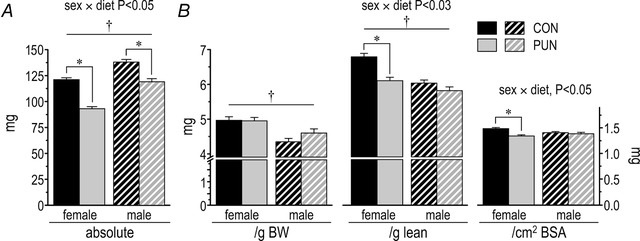
Figure 3. Heart weight of female and male CON and PUN mice at PN80.

Data are presented in absolute terms (A), or normalized to body weight (BW), lean mass, or body surface area (BSA) (B). Values are mean ± SEM; sex × diet P < 0.05; * P < 0.001 for CON vs. PUN; † P < 0.001 for male vs. female)
