Figure 1.

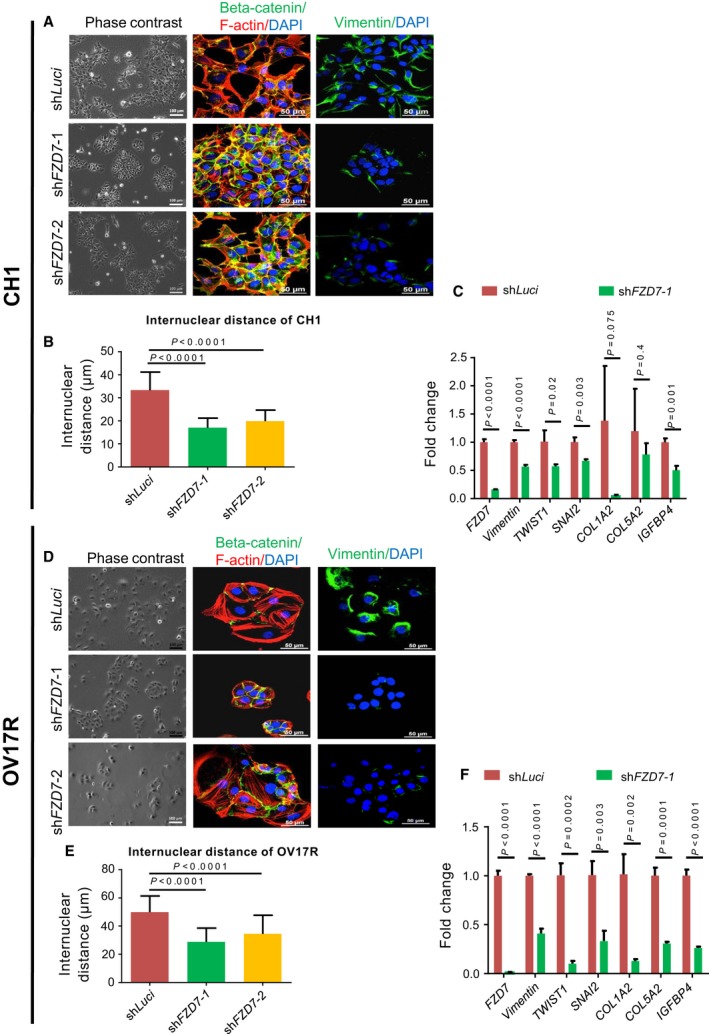
shFZD7 conferred an epithelial‐like phenotype and downregulation of EMT‐related genes. Morphology of (A) CH1‐shLuci, CH1‐shFZD7‐1, and CH1‐shFZD7‐2 clones and (D) OV17R‐shLuci, OV17R‐shFZD7‐1, and OV17R‐shFZD7‐2 clones shown in phase‐contrast images (left panel), IF staining (middle panel) of β‐catenin (green) and F‐actin (red), and vimentin (right panel) together with the nuclear staining of DAPI (blue). Scale bars indicated 100 μm for phase‐contrast images and 50 μm for IF images. Bar charts showing the internuclear distance (y‐axis, μm) of (B) CH1‐shLuci (dark red bars), CH1‐shFZD7‐1 (green bars), and CH1‐shFZD7‐2 (orange bars)clones (x‐axis) and (E) OV17R‐shLuci (dark red bars), CH1‐shFZD7‐1 (green bars), and CH1‐shFZD7‐2 (orange bars) clones. Error bars indicated SEM. Unpaired t‐tests were performed for statistical significance. Bar charts showing the fold change (y‐axis) of FZD7, vimentin, TWIST1,SNAI2,COL1A2,COL5A2, and IGFBP4 mRNA expression (2−∆∆Ct) in (C) CH1‐shLuci (dark red bars), shFZD7‐1(green bars) clones normalized to CH1‐shLuci and in (F) OV17R‐shLuci (dark red bars), shFZD7‐1 (green bars) clones normalized to OV17R‐shLuci. mRNA expression levels were measured by qPCR normalized to a panel of housekeeping genes, ACTB, B2M,GAPDH,RPL13A, and HPRT1. Error bars indicated SEM. Unpaired t‐tests were performed for statistical significance.
