Figure 2.

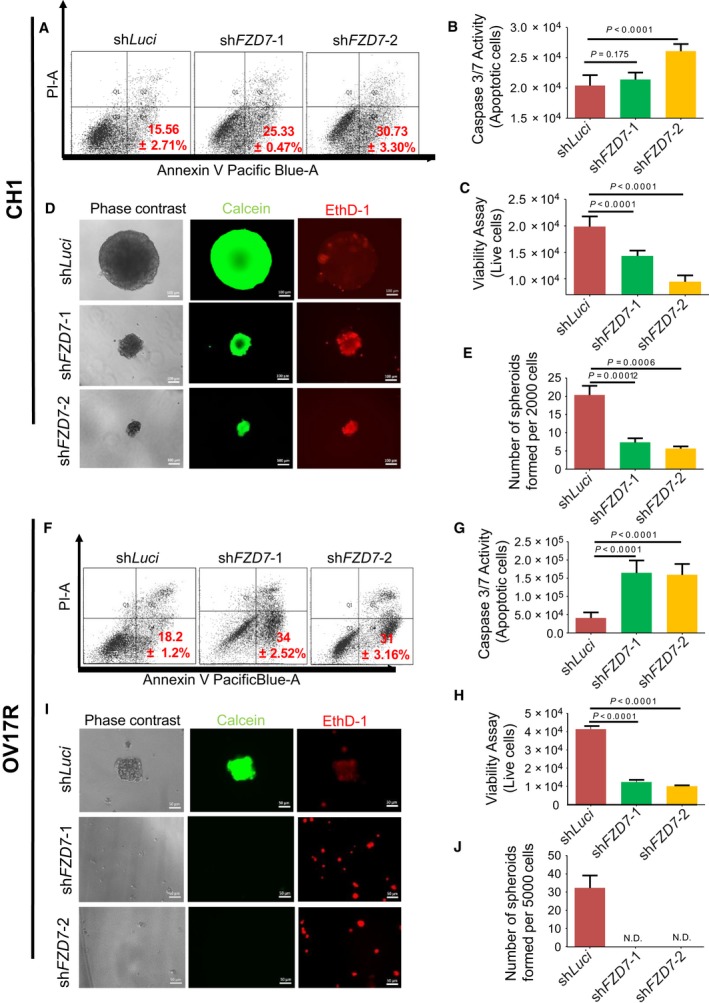
shFZD7 reduced the anoikis resistance and spheroid formation ability of CH1 and OV17R. Percentage of apoptotic (A) CH1‐shLuci, CH1‐shFZD7‐1, and CH1‐shFZD7‐2 and (F) OV17R‐shLuci, OV17R‐shFZD7‐1, and OV17R‐shFZD7‐2 cells after 48 h in suspension, as analyzed by flow cytometry (10 000 events). The percentage of Annexin V+/PI− were considered apoptotic. Values (mean ± SD) in red denoted the percentage of apoptotic cells from three independent experiments. X‐axis: the levels of Annexin V tagged with pacific blue; y‐axis: the levels of PI. Bar charts showing the caspase 3/7 activities—apoptotic cells (y‐axis) for (B) CH1‐shLuci (dark red bars), CH1‐shFZD7‐1 (green bars), and CH1‐shFZD7‐2 (orange bars) cells (x‐axis) and (G) OV17R‐shLuci (dark red bars), OV17R‐shFZD7‐1 (green bars), and OV17R‐shFZD7‐2 (orange bars) cells (x‐axis). Viability assay showing live cells (y‐axis) for (C) CH1‐shLuci (dark red bars), CH1‐shFZD7‐1(green bars), and CH1‐shFZD7‐2 (orange bars) cells (x‐axis) and (H) OV17R‐shLuci (dark red bars), OV17R‐shFZD7‐1 (green bars), and OV17R‐shFZD7‐2 (orange bars) cells (x‐axis). Cells were seeded at a density of 10 000 cells per well in flat‐bottom ULA 96‐well plates for three wells per clone. After 72 h, cell viability was measured by fluorescence reading (400Ex/505Em), and cell death was measured by luminescence readout. (D) CH1‐shLuci, CH1‐shFZD7‐1, and CH1‐shFZD7‐2 cells were seeded at a density of 200 cells per well and (I) OV17R‐shLuci, OV17R‐shFZD7‐1, and OV17R‐shFZD7‐2 cells were seeded at a density of 500 cells per well in flat‐bottom ULA 96‐well plates for 10 wells per clone. After 14 days in culture, phase‐contrast images (left panel), calcein‐AM staining (middle panel) for viable cells, and EthD‐1 staining (right panel) for dead cells were analyzed. Scale bars represented 100 μm (CH1) and 50 μm (OV17R). Bar charts showing numbers of spheroids formed (y‐axis) in (E) CH1 clones (x‐axis) and (J) OV17R clones after 7 days in suspension. Only spheroids with a diameter greater than 50 μm were counted. Error bars indicated SEM. Unpaired t‐tests were performed for statistical significance.
