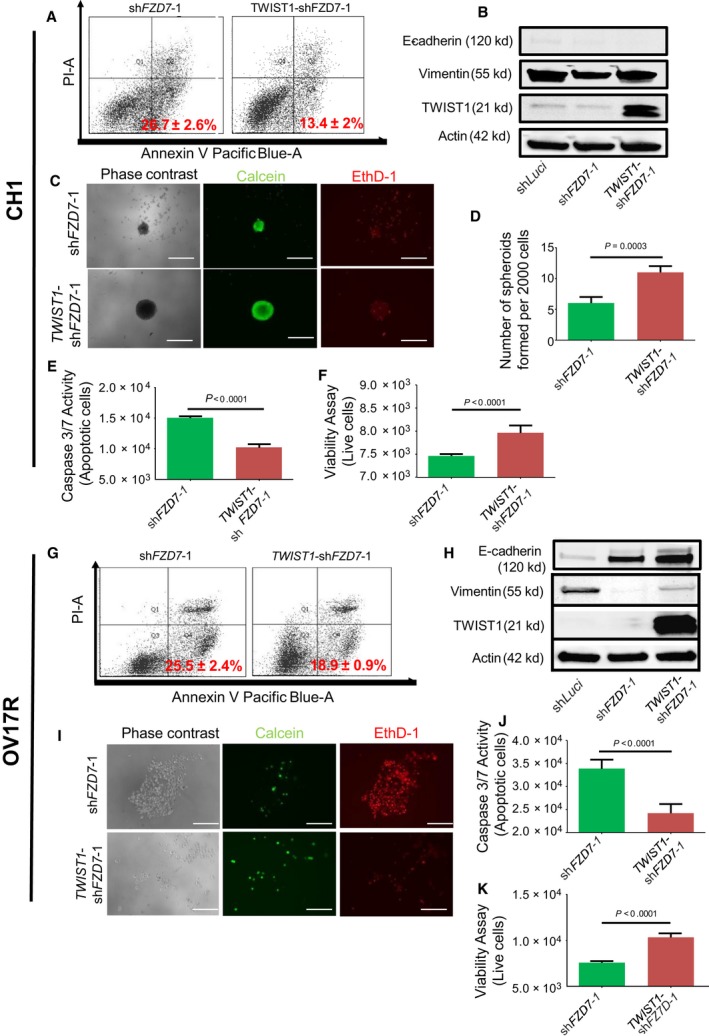
Figure 4.

TWIST1 rescued the anoikis resistance in shFZD7 clones. Percentage of apoptotic (A) CH1‐shFZD7‐1 and TWIST1‐CH1‐shFZD7‐1 and (G) OV17R‐shFZD7‐1 and TWIST1‐OV17R‐shFZD7‐1 after 72 h in suspension, as analyzed by FACS (10 000 events). The percentage of Annexin V+/PI − were considered apoptotic. Values (mean ± SD) in red denote the percentage of apoptotic cells from three independent experiments. X‐axis: the levels of Annexin V tagged with pacific blue; y‐axis: the levels of PI. Western blots for E‐cadherin, vimentin, TWIST1, and Actin in (B) CH1‐shFZD7‐1 and TWIST1‐CH1‐shFZD7‐1 clones and in (H) OV17R‐shFZD7‐1 and TWIST1‐OV17R‐shFZD7‐1 clones. (C) CH1‐shFZD7‐1, TWIST1‐CH1‐shFZD7‐1 cells were seeded at a density of 200 cells per well and (I) OV17R‐shFZD7‐1, TWIST1‐OV17R‐shFZD7‐1 cells were seeded at a density of 500 cells per well in flat‐bottom ULA 96‐well plates for 10 wells per clone. After 10 days, phase‐contrast images, calcein‐AM staining for viable cells, and EthD‐1 staining for dead cells were analyzed. Spheroid quantification (D) shows number of spheroids formed per 2000 cells. Scale bars represented 100 μm. Bar charts showing the caspase 3/7 activities—apoptotic cells (y‐axis) for (E) CH1‐shFZD7‐1 (green bars), TWIST1‐CH1‐shFZD7‐1 (dark red bars; x‐axis) and (J) OV17R‐shFZD7‐1 (green bars), TWIST1‐OV17R‐shFZD7‐1 (dark red bars; x‐axis). Viability assay showing live cells (y‐axis) for (F) CH1‐shFZD7‐1 (green bars), TWIST1‐CH1‐shFZD7‐1 (dark red bars; x‐axis) and (K) OV17R‐shFZD7‐1 (green bars), TWIST1‐OV17R‐shFZD7‐1 (dark red bars; x‐axis). Error bars indicated SEM. Unpaired t‐tests were performed for statistical significance.
