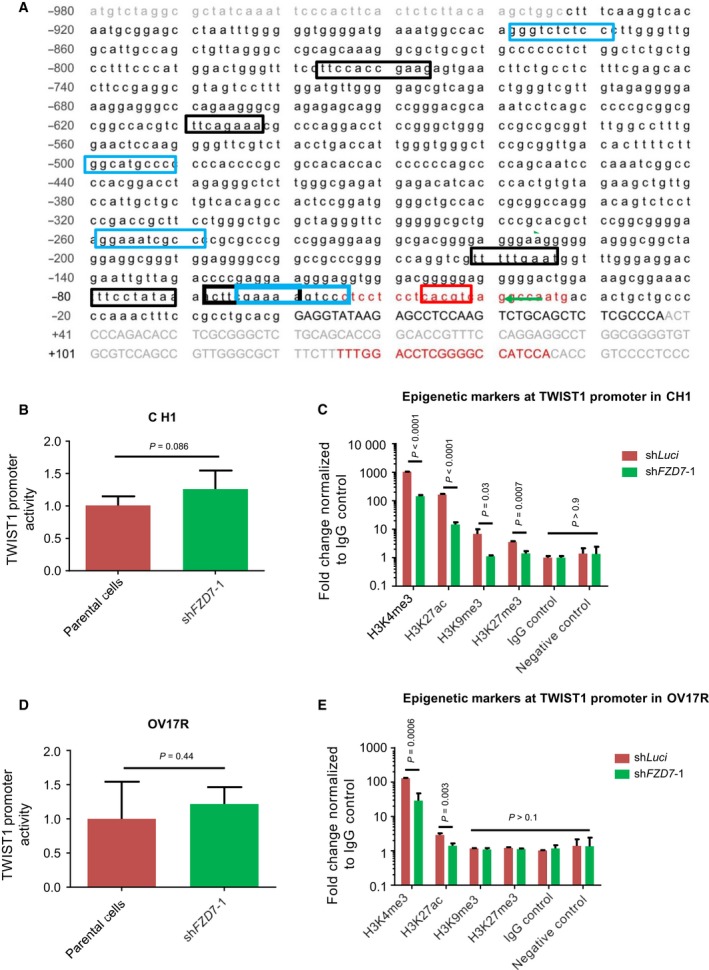
Figure 5.

shFZD7 induced epigenetic modifications of TWIST1 promoter. (A) The sequence of the TWIST1 promoter region (black text) from −933 to +37 relative to the TSS with NF‐κB binding sites (blue box), STAT3 binding sites (black box), and an HIF1α binding site (red box). The primer sequences for histone marker ChIP‐qPCR (red text) amplifying the region from −65 to +136 were also shown. Bar charts showing the TWIST1 promoter activities in (B) CH1‐shFZD7‐1 normalized to CH1 and in (D) Ov17R‐shFDZ7‐1 normalized to OV17R. Bar charts showing the enrichments represented by the fold change of percentage of input normalized to IgG control (y‐axis) of H3K4me3, H3K27ac, H3K9me3, H3K27ac, and IgG control (x‐axis) at the TWIST1 promoter in (C) CH1‐shLuci (dark red bars) and CH1‐shFZD7‐1 (green bars) and in (E) OV17R‐shLuci (dark red bars) and OV17R‐shFZD7‐1 (green bars). Unpaired t‐tests were performed for statistical significance.
