Figure 6.

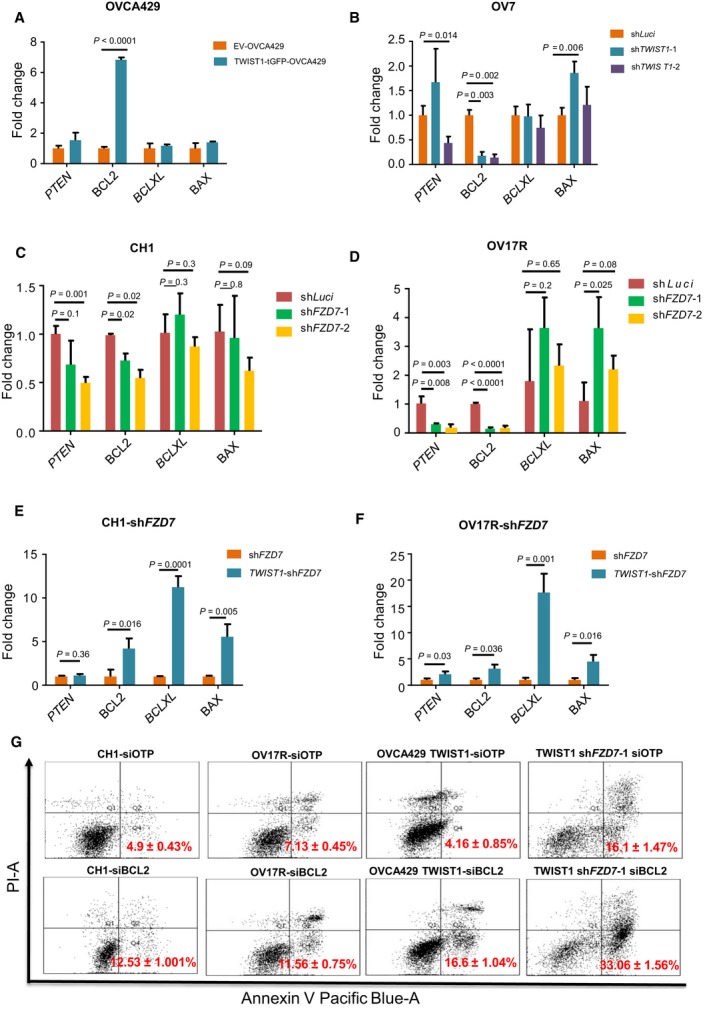
FZD7‐TWIST1 regulates anoikis resistance by activating its downstream effector BCL2. Bar charts showing the fold change (y‐axis) of PTEN,BCL2,BCLXL, and BAX (x‐axis) mRNA expression (2−∆Ct) in (A) TWIST1‐tGFP‐OVCA429 (dark aqua bars) normalized with EV‐OVCA429 (orange bars); (B) OV7‐shTWIST1‐1 (dark aqua bars) and shTWIST1‐2 (purple bars) normalized with OV7‐shLuci (orange bars); (C) CH1‐shFZD7‐1 (green bars), CH1 shFZD7‐2 (orange bars) normalized with CH1shLuci (dark red bars); (D) OV17R‐shFZD7‐1 (green bars), OV17R‐shFZD7‐2 (orange bars) normalized with OV17R‐shLuci (dark red bars); (E) TWIST1‐CH1‐shFZD7 (aqua dark bars) normalized with CH1‐shFZD7 (dark orange bars); (F) TWIST1‐OV17R‐shFZD7 (aqua dark bars) normalized with OV17R‐shFZD7 (dark orange bars). mRNA expression levels are measured by qPCR normalized with a panel of housekeeping genes, ACTB, B2M,GAPDH,RPL13A, and HPRT1. (G) Percentage of apoptotic cells in CH1 (siOTP and siBCL2), OV17R (siOTP and siBCL2), OVCA429 TWIST1 (siOTP and siBCL2) and TWIST1‐CH1‐shFZD7 (siOTP and siBCL2) after 72 h in suspension, as analyzed by FACS (10 000 events). Values (mean ± SD) in red denoted the percentage of apoptotic cells from three independent experiments. X‐axis: the levels of Annexin V tagged with pacific blue; y‐axis: the levels of PI. Error bars indicated SEM. Unpaired t‐tests were performed for statistical significance.
