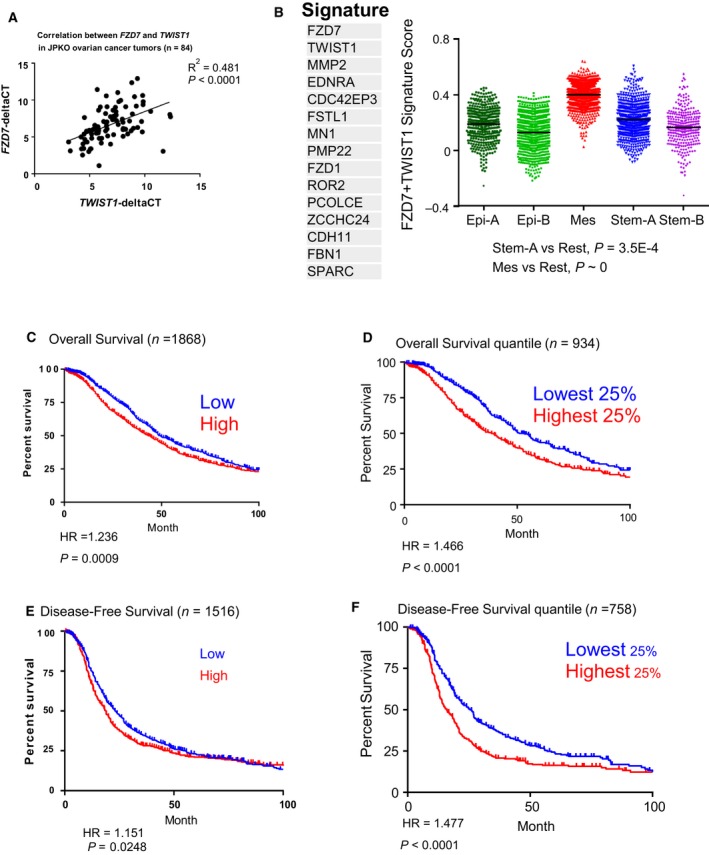
Figure 7.

FZD7‐TWIST1 signature predicts poor survival. (A) Scatter plot showing the correlation between FZD7 (y‐axis) and TWIST1 (x‐axis) mRNA expression in a Japanese OC cohort (GSE30311). (B) Distribution of FZD7‐TWIST1 signature score (y‐axis) among the Epi‐A (dark green), Epi‐B (light green), Mes (red), Stem‐A (blue), and Stem‐B (purple) subtypes in CSIOVDB. Kaplan–Meier curves of median overall survival (C), disease‐free survival (E), and the highest and lowest quartiles of the FZD7‐TWIST1 signature score for overall survival (D), disease‐free survivals (F) in OC patients. Stratified by the first and last quartiles of the FZD7‐TWIST1 signature score.
