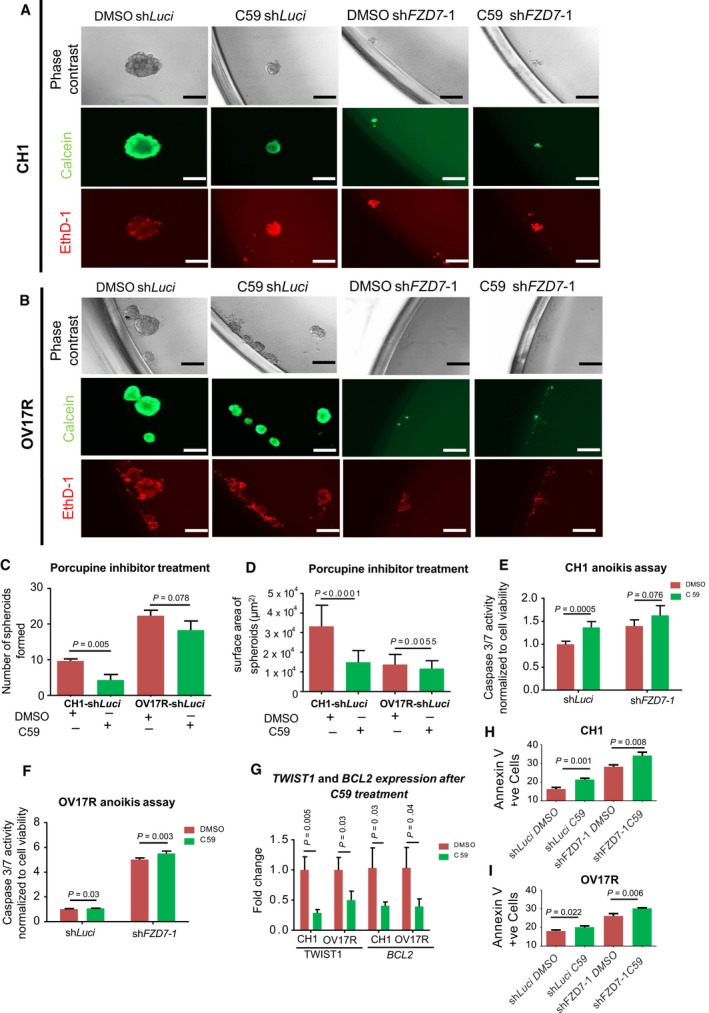
Figure 8.

PORCN inhibitor C59 treatment in CH1 and OV17R clones. (A) CH1‐shLuci, CH1‐shFZD7‐1 cells were seeded at a density of 200 cells per well and (B) OV17R‐shLuci, OV17R‐shFZD7‐1 cells were seeded at a density of 500 cells per well in flat‐bottom ULA 96‐well plates for 10 wells per clone. After 10 days in culture with DMSO or C59 treatment, phase‐contrast images, calcein‐AM staining for viable cells, and EthD‐1 staining for dead cells were analyzed. Scale bars represented 200 μm. Bar charts showing (C) the numbers and (D) the surface areas of spheroids formed by CH1‐shLuci and OV17R‐shLuci with DMSO (dark red bars) or C59 (green bars) treatment for 10 days in suspension. Only spheroids with a diameter greater than 50 μm were counted. Bar charts showing caspase 3/7 activities (y‐axis) of DMSO (dark red bars) or C59 (green bars) treated (E) CH1‐Luci, CH1‐shFZD7‐1, and (F) OV17R‐Luci, OV17R‐shFZD7‐1 clones. Cells were seeded at a density of 10 000 cells per well in flat‐bottom ULA 96‐well plates for three wells per clone. After 72 h, cell viability was measured by fluorescence reading (400Ex/505Em) and cell death was measured by luminescence readout. (G) Bar charts showing the fold change of TWIST1 (left) and BCL2 (right) mRNA expression (2−∆Ct; y‐axis) in CH1‐shLuci and OV17R‐shLuci with DMSO (dark red bars) or C59 (green bars) treatment for 3 days. mRNA expression levels were measured by qPCR normalized with a panel of housekeeping genes, ACTB, B2M,GAPDH,RPL13A, and HPRT1. (H) Bar chart showing percentage of Annexin V‐positive cells in CH1‐shLuci, CH1‐shFZD7‐1, (I) OV17R‐shLuci and OV17R shFZD7‐1 after treating the cells with DMSO control (dark red bars) and C59 (green bars). Values (mean ± SD) for Annexin V‐positive cells denoted the percentage of apoptotic cells from three independent experiments. Error bars indicated SEM. Unpaired t‐tests were performed for statistical significance. C59 was used to treat cells at a final concentration of 10 nm. Unpaired t‐tests were performed for statistical significance.
