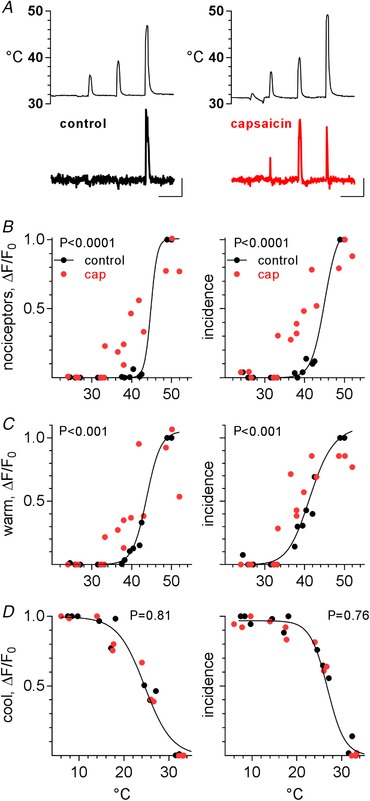
Figure 7. Pretreatment with capsaicin sensitizes nociceptors and warm‐sensing trigeminal ganglion neurons.

A, response of a representative nociceptor to thermal stimulation before (left) and after (right) a 10 s lavage with 100 μm capsaicin. Note that after capsaicin this nociceptor began to respond to warm (<45 °C) thermal stimulation. Upper traces, temperature of oral mucosa. Calib, 100 s, 0.5 ΔF/F 0. B–D, temperature–response relations for nociceptors, warm and cool trigeminal ganglion neurons (3 mice, 81, 28, and 150 neurons, respectively), followed before (black symbols) and after (red symbols) oral capsaicin lavage. Each point shows data from a single mouse. For each row of temperature–response relations, the left plots show response amplitudes (mean ΔF/F 0) and the right plots show response incidences. The data for each mouse have been normalized to the maximum values obtained before capsaicin. Continuous line is best‐fit sigmoidal curve (GraphPad Prism) for data before capsaicin. P‐values show significance of difference between before/after data in each plot.
