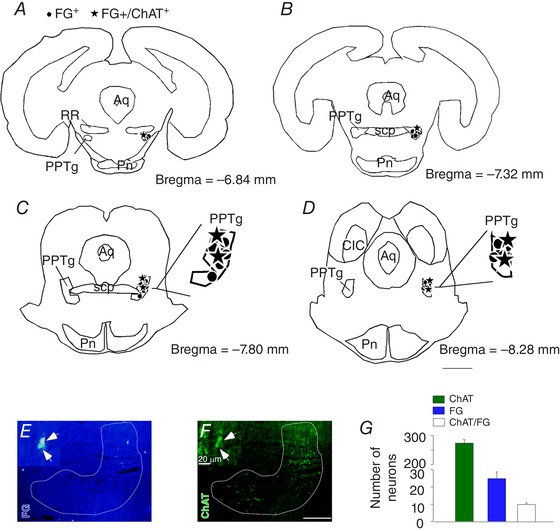
Figure 4. Cholinergic projection from the PPTg to the RTN.

A–D, schematic drawing depicting the location of all FG‐labelled cells and FG+/ChAT+ cells through the PPTg region. E, photomicrography showing retrograde FG tracer in the PPTg region. F, immunoreactivity for ChAT in the PPTg region. G, total number of PPTg neurons detected in four sections per brain (ChAT and FG only, FG+/ChAT+). Aq, aqueduct mesencephalic; CIC, central inferior colliculus; PN, pontine nucleus; RR, retrorubral nucleus; scp, superior cerebellar peduncle. Scale bar = 2 mm in (D); 100 μm in (F) applied to (E) and (F) and 20 μm in (F´) applied to (E´) and (F´). [Color figure can be viewed at wileyonlinelibrary.com]
