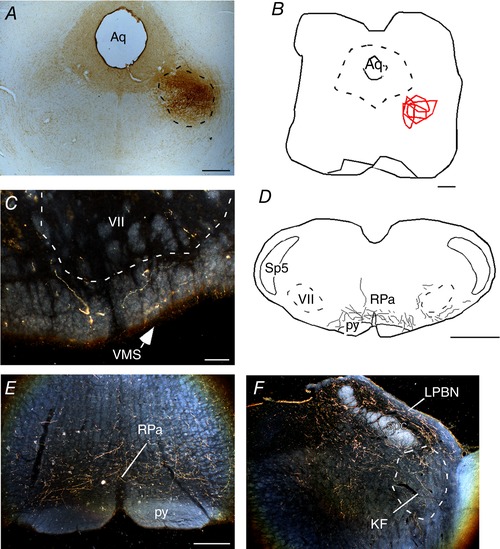
Figure 5. Projection of the PPTg to the RTN.

A, photomicrography showing the typical site anterograde neuronal tracer injection PHA‐L in the PPTg. B, schematic drawing showing the location PHA‐L injections (n = 4) in the region of the PPTg. C, E and F, photomicrographs showing varicosities in the region of the RTN (C); raphe pallidus (E) and Kölliker‐Fuse region (F). D, schematic drawing showing varicosities in RTN regions. Aq, aqueduct mesencephalic; KF, Kölliker‐Fuse; LPBN, lateral parabrachial nucleus; py, pyramidal tract; RPa, raphe pallidus; scp, superior cerebellar peduncle; Sp5, spinal trigeminal nucleus; VMS, ventral medullary surface; VII, facial motor nucleus. Scale bar = 1 mm in (A), (B) and (D); 100 μm in (C) and 300 μm in (E) applied to (E) and (F). [Color figure can be viewed at wileyonlinelibrary.com]
