
Figure 1. Experimental setup overview and motor unit decomposition.
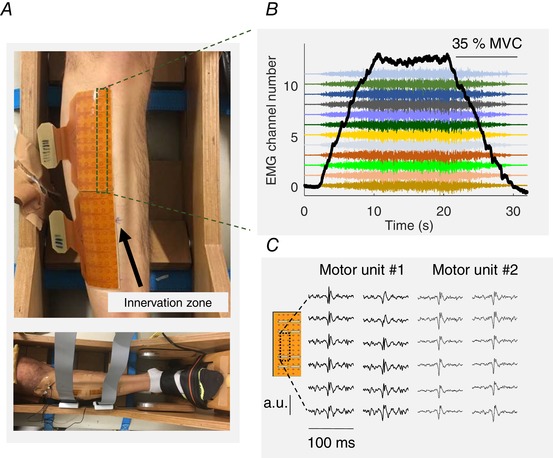
A, two high‐density grids of electrodes placed over the tibialis anterior muscle (64 electrodes in each grid). B, representative trapezoidal ramp isometric contraction (force signal in black) with the simultaneous recorded high‐density electromyogram (monopolar recordings). Only one column of the grid (indicated with a dashed rectangle) is shown. C, an example of two motor unit action potentials extracted from the decomposition analysis. The location of the motor action potential is indicated by the dashed rectangle.