
Figure 2. Number of identified motor units as a function of recruitment threshold and target force.
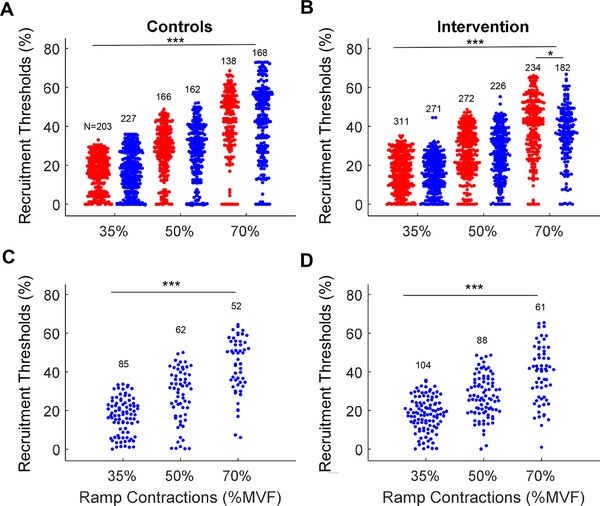
Swarm plots of all the motor units identified for the control (A) and strength‐training (B) groups. The blue and red dots represent the motor unit recruitment thresholds (y‐axis) identified at the start and end of the intervention, respectively. The three target forces (35%, 50% and 70% of maximal voluntary force, MVF) are shown on the x‐axis. C and D, the average recruitment thresholds of the motor units that were tracked at the start and the end of the intervention, for both the control (C) and strength‐training (D) groups. * P < 0.05, *** P < 0.001.