
Figure 3. Discharge times for motor units across the 4‐week intervention.
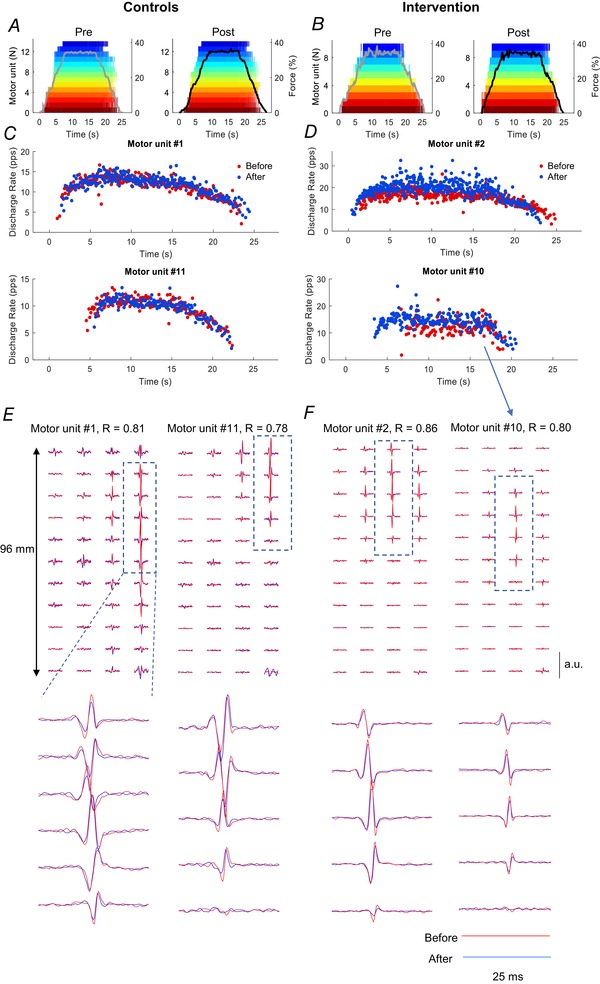
Discharge times for motor units that were tracked across the 4 week intervention in one subject from the Control group (left column) and one subject from the strength‐training group (right column). A and B, force exerted by the ankle dorsiflexors (grey and dark lines, before and after the intervention, respectively) during an isometric contraction up to 35% of maximal voluntary force. Each colour represents the discharge times of the same motor unit across sessions. Note the preservation of recruitment and decruitment order across session for the tracked units. C and D, instantaneous discharge rates for two representative motor units from the two subjects during the trapezoidal contraction. E and F, motor unit action potentials obtained from bipolar high‐density EMG signals corresponding to the motor units displayed in (C) and (D) (#1 and #11 for the control subject and #2 and #10 for the subject in the strength‐training group). The columns and rows represent the dimensions of the high‐density electrode. The motor unit signatures were extracted by spike‐triggered averaging from the discharge times shown in (A) and (B). Each trace comprising two waveforms, one from before the intervention (blue) and one after the intervention (red). The two lines are almost indistinguishable, which results in a high two‐dimensional correlation coefficients (r) both before and after the 4 week intervention.