
Figure 4. Scatter plots of the recruitment thresholds.
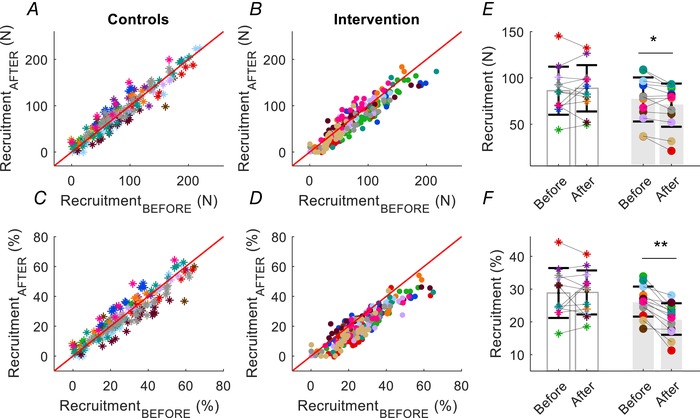
Scatter plots of the recruitment thresholds for the same motor units in each participant in the control (asterisks) and strength‐training groups (intervention, filled circles). Each subject is indicated by a different colour. The recruitment thresholds are shown before (on the ordinate) and after (on the abscissa) the intervention. A and B, upper: absolute recruitment thresholds (N) for all the identified motor units. C and D, lower: normalized recruitment threshold expressed as a percentage of maximal voluntary force (% MVF). Average values for absolute (E) and normalized (F) motor unit recruitment thresholds across all motor units for each subject for the control and strength‐training groups (grey bars). * P < 0.05, ** P < 0.01. Data are reported as the mean ± SD.