
Figure 8. Distribution of motor unit interspike intervals.
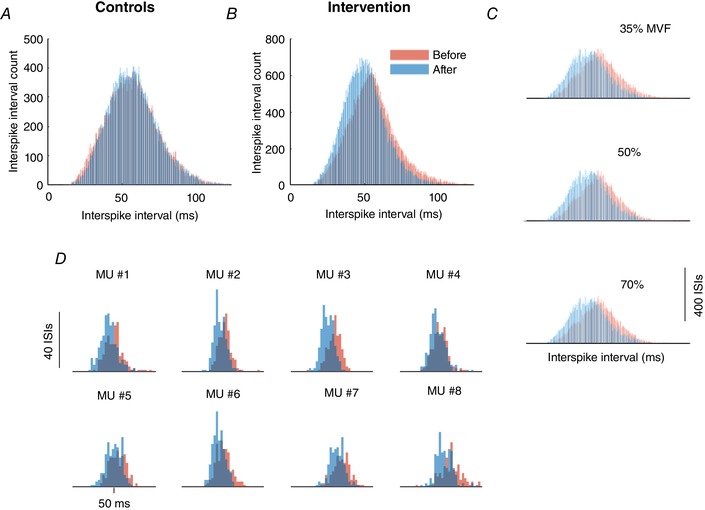
Histograms of motor unit interspike intervals (ISIs) are shown for the control (A) and strength‐training (B) groups at the start (red) and end (blue) of the intervention. C, ISI histograms for the three target forces (35%, 50% and 70% MVF) for the strength‐training group. D, ISI histograms for eight motor units in one representative subject in the strength‐training group.