
Figure 9. Scatter graphs of the differences in force and discharge rate between the plateau phase for the trapezoidal contraction and recruitment threshold during the ramp contraction.
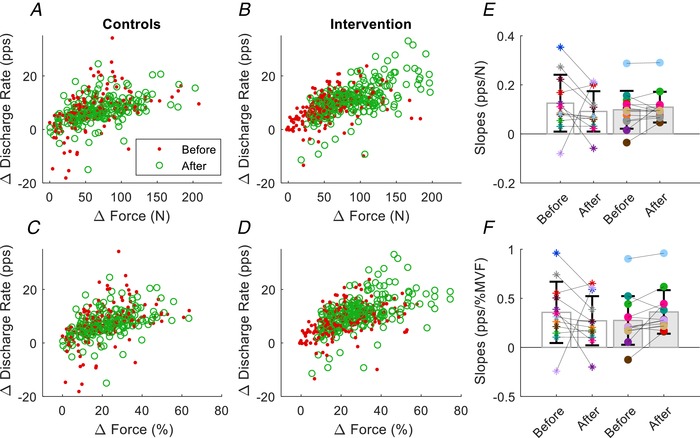
Each circle represents one motor unit. A and B, absolute recruitment thresholds for the two groups. C and D, relative recruitment threshold for the two groups. E, rate of change in absolute (pps/N) and relative (F, pps/% MVF) discharge rate for each subject (open bar for the controls). Data are reported as the mean ± SD.